
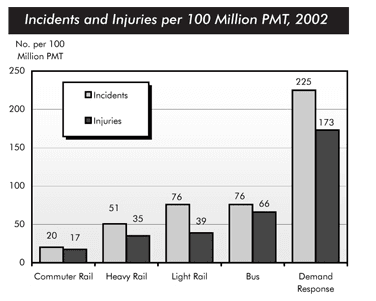
The bar chart provides information about the number of incidents and injuries per 100
million
miles travelled by people using a specific kind of transport in 2002.
Looking from the Use synonyms
overall
perspective it is readily apparent that incidence were more common than injuries during the whole year. Linking Words
Moreover
, demand response was the most dangerous group, Linking Words
while
commuter Linking Words
rail
was the safest one.
With regards to the incidents, the segment with the lowest amount was commuter Use synonyms
rail
(20 accidents per 100 Use synonyms
million
passengers), followed by heavy Use synonyms
rail
(51). Use synonyms
In addition
, light Linking Words
rail
and bus divided third place and accounted for 76 for both categories. Use synonyms
Moreover
, demand response was a leader with 225 cases.
Linking Words
According to
the graph, the lowest number of injuries had individuals, who travelled by commuter Linking Words
rail
(17 Use synonyms
million
PMT). Use synonyms
Furthermore
, heavy and light Linking Words
rail
had 35 and 36 Use synonyms
million
PMT respectively, Use synonyms
while
bus transportation had 66 cases. Linking Words
Finally
, most passengers were injured during demand response travelling.Linking Words