
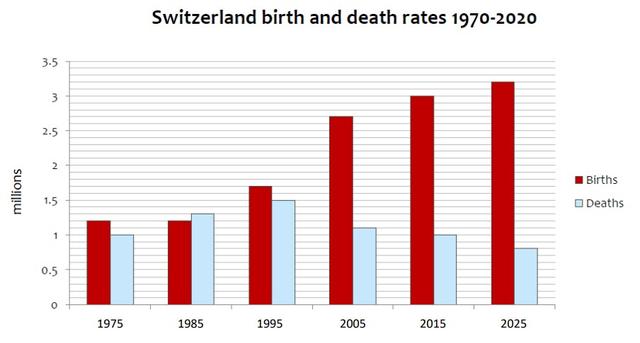
The chart illustrates the number of Swiss people's
birth
and Use synonyms
death
info, who were born between 1970 and 2020 based on United Nations statistics. The Units are measured by millions.
Use synonyms
Overall
, the statistics highlighted the Linking Words
birth
amount increased more than the Use synonyms
death
which inversely said that the population of Switzerland increased within the period of 10 years.
As can be seen in the chart, until 1990 the Use synonyms
birth
and Use synonyms
death
rates were balanced with values below 2 million. It is clear from the evidence that after the 1990s there will be a sudden hike in the rate of Use synonyms
birth
touching values above 2.5 million. The data reveals that the highest Use synonyms
birth
estimate was reported in 2020.
Use synonyms
On the other hand
, it is crystal clear that the Linking Words
death
rates are gradually decreasing after 1990 reaching values below 1.5 million. Use synonyms
According to
the statistics during the period of ,,Linking Words
2000
there has been a huge difference in Add a comma
,2000
birth
and Use synonyms
death
ratesUse synonyms