
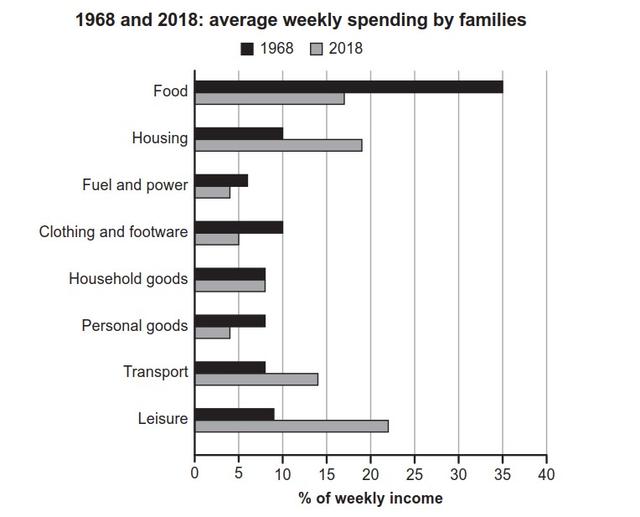
The chart illustrates data about how households spent their weekly earning in different 8 sectors (
food
, housing Use synonyms
fuel
and Use synonyms
power
,clothing and footwear,household Use synonyms
goods
, personal Use synonyms
goods
, transport, and Use synonyms
leisure
) in 1968 and 2018.
Use synonyms
Overall
, it can be seen that the families' expenditure on Linking Words
food
,Use synonyms
fuel
and Use synonyms
power
, clothing and footwear and personal Use synonyms
goods
was more in 1968 compared to 2018 Use synonyms
while
households spent less money on housing,transport, and Linking Words
leisure
in 1968 than in 2018. The highest amount of income was spent on Use synonyms
food
in 1968, Use synonyms
whereas
in 2018 it is Linking Words
leisure
. Use synonyms
Similarly
, the least amount of salary was spent on Linking Words
fuel
and Use synonyms
power
in 1968 Use synonyms
while
it was personal Linking Words
goods
Use synonyms
as well as
Linking Words
fuel
and Use synonyms
power
in 2018.
First of all, in 1968, a family spent 35% of their salary on Use synonyms
food
, but it witnessed a dramatic fall to nearly half in 2018. At the same, family expenditures fell to around 4% in 2018 from over 5% in 1968. Use synonyms
In addition
, clothing and footwear costs plunged to 5% in 2018 from 10% in 1968 and in terms of personal Linking Words
goods
it fell to roughly 4% in 2018 from almost 8% in 1968.
Convergently,in 2018, families' expenditure on housing rose to double from 10% in 1968 to 20% in 2018.In a similar fashion ,regarding transport, it is just below 15% and approximately 10% in 2018 and 1968 respectively. Use synonyms
Nonetheless
, the biggest increase witnessed in Linking Words
leisure
to nearly 23% in 2018 where it was below 10% in 1968. Use synonyms
However
, the household Linking Words
goods
costs remained unchanged in 1968 and in 2018.Use synonyms