
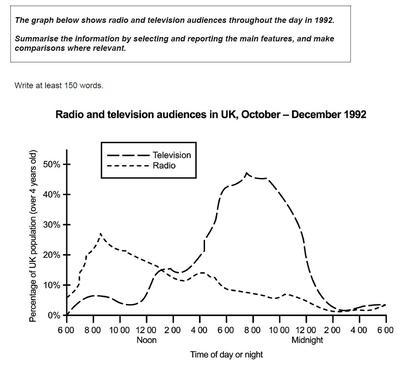
The line graph illustrates the proportion of utilisation of
radio
and television by the UK population during the period of day and night in the year 1992.
Having a myopic look, Use synonyms
it is clear that
the percentage of people using television begins at 0 at 6 am which exceeds Linking Words
radio
with the rate of 16% at 1 pm followed by a massive resurgence and peaks at 8 pm with the percentage of 45. Afterwards, it dramatically declined by 3% during the time of 2 am and Use synonyms
finally
, it followed a steady trend.
Linking Words
On the other hand
, the Linking Words
radio
used by UK people commences from 5 % and peaks at 29% in the day at 8 am. Use synonyms
Furthermore
, it followed a downward movement throughout the period up to 4 am and slightly increased at 6 am by 3%.
Linking Words
Overall
, the percentage of the UK population using television followed an increasing trend at the beginning with a dramatic decline at Linking Words
last
. Linking Words
However
, the Linking Words
radio
audiences followed a decreasing trend throughout the time after a peak at the start.Use synonyms