
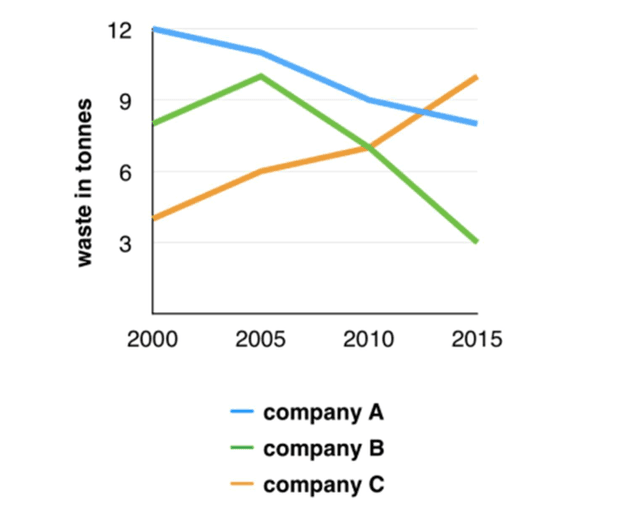
The line chart demonstrates the amounts of misuse in
tonnes
in three enterprises, namely A, Use synonyms
B
and Use synonyms
C
over a period of 15 years. Use synonyms
Company
Use synonyms
C
shows an upward Use synonyms
trend
, Use synonyms
while
enterprise A and firm Linking Words
B
follow a downward Use synonyms
trend
.
The years from 2000 to 2005 saw a moderate rise in the amount of Use synonyms
waste
in Use synonyms
company
Use synonyms
C
from 4 Use synonyms
tonnes
to 6 Use synonyms
tonnes
, growing slightly to 7 Use synonyms
tonnes
in 2010 and dramatically climbing to 10 Use synonyms
tonnes
in 2015.
Use synonyms
However
, Linking Words
company
A and Use synonyms
company
Use synonyms
B
follow an opposite Use synonyms
trend
. The amount of Use synonyms
waste
in firm A saw a moderate decline from 12 Use synonyms
tonnes
in 2000 to 8 Use synonyms
tonnes
in 2015. There is a decrease in the amount of Use synonyms
waste
in firm Use synonyms
B
from 8 Use synonyms
tonnes
in 2000 to 3 Use synonyms
tonnes
in 2015, except a growth from 8 Use synonyms
tonnes
to the peak of 9 Use synonyms
tonnes
.
In conclusion, it is clearly seen that Use synonyms
company
Use synonyms
B
and Use synonyms
company
Use synonyms
C
have declined their Use synonyms
waste
from 2000 to 2015. They pay much attention to reducing Use synonyms
waste
. Use synonyms
On the contrary
, enterprise A keeps an upward Linking Words
trend
at the same period. It should raise awareness of declining Use synonyms
waste
, which is very vital.Use synonyms