
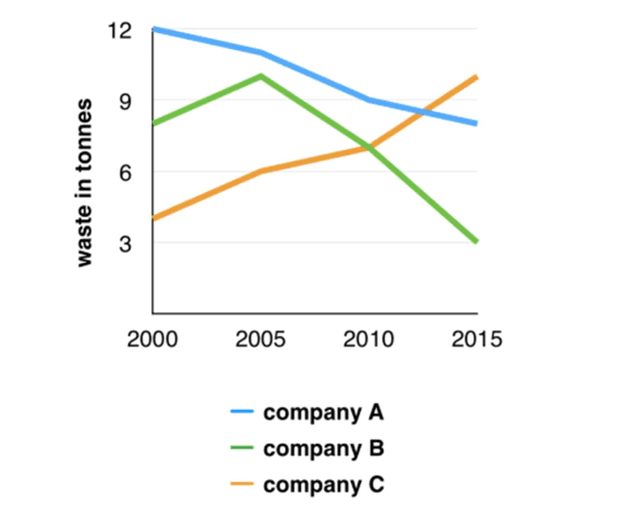
The line graph illustrates the quantities of leftovers by
companies
A, Use synonyms
B
, and Use synonyms
C
throughout 15 Use synonyms
years
. Use synonyms
Overall
, Linking Words
companies
A and Use synonyms
B
have reduced Use synonyms
waste
Use synonyms
production
over time, Use synonyms
while
Linking Words
company
Use synonyms
C
has increased Use synonyms
waste
Use synonyms
production
.
Even though Use synonyms
Company
A produced the highest amount of leftovers in the year 2000 at 12 Use synonyms
tonnes
, in 15 Use synonyms
years
they reduced the Use synonyms
production
of Use synonyms
waste
by almost 4 Use synonyms
tonnes
. Use synonyms
Therefore
there was a significant reduction in Linking Words
waste
Use synonyms
production
at Use synonyms
company
A. In the first 5 Use synonyms
years
, there were drastic increases in Use synonyms
waste
Use synonyms
production
in Use synonyms
companies
Use synonyms
B
and Use synonyms
C
but, the quantity of leftovers dramatically reduced after 2005 until 2015 in Use synonyms
Company
Use synonyms
B
, Use synonyms
while
Linking Words
Use synonyms
company
Capitalize word
Company
C
significantly increased their Use synonyms
waste
quantity from six Use synonyms
tonnes
to ten Use synonyms
tonnes
over ten Use synonyms
years
.
Use synonyms
However
, Linking Words
Company
Use synonyms
C
produced the lowest amount of Use synonyms
waste
in the year 2000, compared to the other two Use synonyms
companies
but , in the year 2015, Use synonyms
Company
Use synonyms
C
produced the highest amount of Use synonyms
waste
compared to the other 2 Use synonyms
companies
. Use synonyms
In contrast
with the three Linking Words
companies
, Use synonyms
company
Use synonyms
B
had the lowest Use synonyms
waste
Use synonyms
production
in 2015, and they have reduced their Use synonyms
waste
Use synonyms
production
by five Use synonyms
tonnes
over 15 Use synonyms
years
.Use synonyms