
The bar graph shows
the
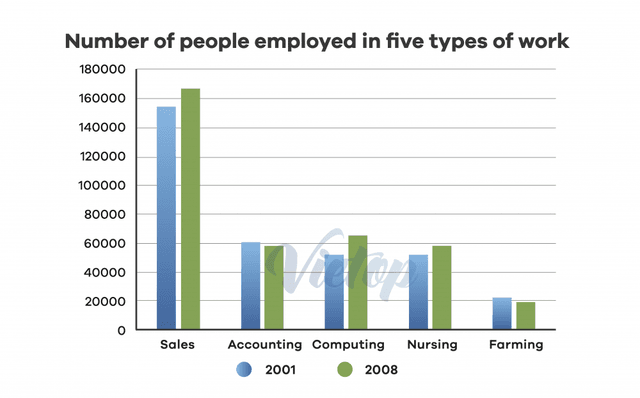
information about how many people worked in five different work types in a specific location in Australia in the years 2001 and 2008. Correct article usage
apply
Overall
, in both years, the highest number of people worked in the Sales Linking Words
department
Use synonyms
while
the lowest number was seen in the Farming Linking Words
department
.
Use synonyms
To begin
with, the number of people employed in Sales in the year 2001 was 180000. Linking Words
This
figure increased by a small value to approximately 190000 in 2008. The same pattern of increment was shown by the Computing Linking Words
department
Use synonyms
as well as
the Nursing Linking Words
department
. In the Computer field, 100,000 humans worked in the initial year considered and raised to 110000 by 2008. Moving Use synonyms
Further
, around 50,000 workers were in the medical division in 2008 .
It is evident that the employees in the Accounting and Agriculture Linking Words
department
got reduced in the given time period by a value of 10,000 to reach 80,000 and 20,000 respectively.Use synonyms