
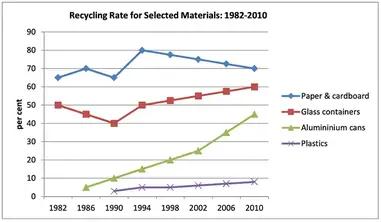
The graph illustrates the percentage of
a
variation in equipment, Correct article usage
apply
paper
cardboard, glass containers, plastics , and aluminium that were recycled from 1982 to 2010 in a particular country.
Use synonyms
Overall
, It is clearly seen that ,is Linking Words
paper
cardboard has a higher rate among the other materials Use synonyms
,
than plastics .
Remove the comma
apply
According to
the graph information , the Linking Words
paper
had been trained to the peak of the rate at 80% at the beginning of the period in 1994, Use synonyms
then
class containers observe became record figure 60%, both of they started in 1990.Linking Words
Whereas
, the Aluminium cans increased dramatically from 1986 until 2010 by 40%, Linking Words
,
On other Change the punctuation
apply
besides
plastics has growth slightly from 1990 to 2010 , From all these results we can be sure that high point attended by Linking Words
paper
recycled.Use synonyms