
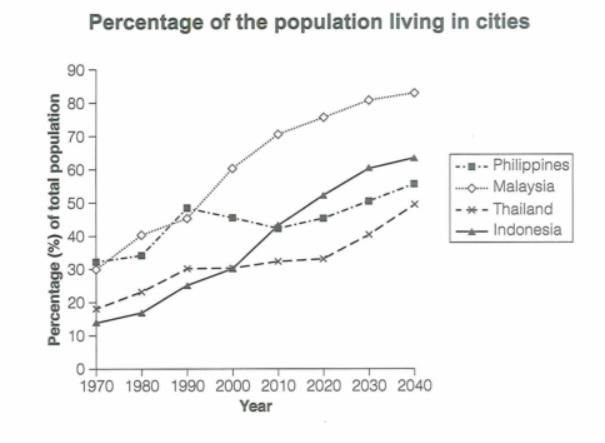
The given line chart illustrates the proportions of people living in cities in the Philippines, Malaysia, Thailand and Indonesia between 1970 and 2020, and forecasts for 2030 and 2040.
Overall
, Linking Words
it is clear that
after a period of 50 years, Malaysia held the highest proportion of the population living in cities and is predicted to remain in its rank position in the future, Linking Words
whereas
Thailand had the lowest percentage of that.
It can be observed that in 1970 the Philippines had the highest figure at approximately 33% and slightly increased by 1% in the next year before a sudden growth in 1990 at almost 50%. Linking Words
Moreover
, in the next 20 years, the figure for the Philippines experienced a downward trend before reaching just above 45% in 2020. The rest of 4 Asian countries followed an upward trend over the course of 50 years. The percentage of Malaysians living in cities rocketed from 30% in 1970 to about 75% in 2020. Linking Words
In addition
, the proportions of Thailand and Indonesia in 1970 were 14% and 19% respectively before being equal at roughly 30% in 2000.Linking Words