
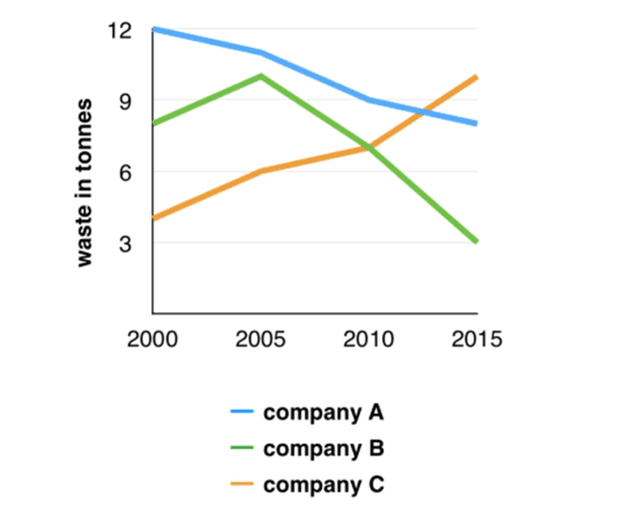
The line graph illustrates the
waste
in Use synonyms
tonnes
that three companies, named A, Use synonyms
B
, and C emitted from 2000 to 2015.
Use synonyms
Overall
, it is noteworthy that A and Linking Words
B
showed their downtrends in Use synonyms
waste
Use synonyms
while
C produced more Linking Words
waste
Use synonyms
overtime
. Another point worth highlighting is that A led the first place most of the time in Correct your spelling
over time
produced-
Correct your spelling
produced waste
waste
.
Regarding A and Use synonyms
B
company, the former stood at the highest amount of 12 Use synonyms
tonnes
of Use synonyms
waste
in 2000, which was followed by the latter with about 4 Use synonyms
tonnes
of trash lower. Use synonyms
Overtime
, Correct your spelling
Over time
the
company A witnessed a gradual drop Correct article usage
apply
whereas
Linking Words
the
Correct article usage
apply
firm
Use synonyms
B
Use synonyms
had
peaked at about 10 Unnecessary verb
apply
tonnes
in 2010 before it fell sharply later on. In 2015, roughly 8 Use synonyms
tonnes
of Use synonyms
waste
was recorded at Use synonyms
the
Correct article usage
apply
firm
A, in the Use synonyms
mean time
, only 3 Correct your spelling
meantime
tonnes
of Use synonyms
waste
was produced at Use synonyms
the
Correct article usage
apply
firm
Use synonyms
B
.
On Use synonyms
contrary
, Correct article usage
the contrary
the
Correct article usage
apply
firm
C reported about 4 Use synonyms
tonnes
in 2000, surpassed Use synonyms
over
Change preposition
apply
the
company Correct article usage
apply
B
and A in the next 15 years, and rose significantly to Use synonyms
estimately
10 Correct your spelling
estimated
estimate
tonnes
in 2015, which was the highest amount compared to the others.Use synonyms