
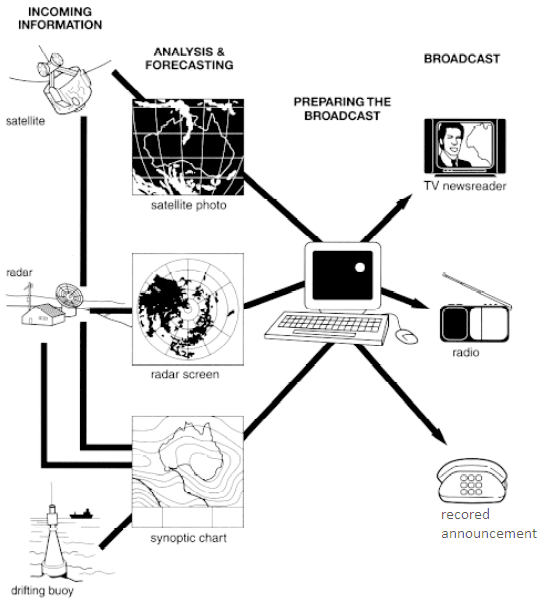
The diagram illustrates the steps involved in the production of relevant information about the weather forecast. There are several stages of making the proper predictions, from the step where the information comes to the final broadcast.
The first step is
that the information gets from the satellite, and Linking Words
then
turns into the satellite photo. The second way is that the data from the atmosphere goes to the radar, where it is processed in order to create the radar screen. In some cases, the drifting buoy can Linking Words
also
create the synoptic chart, which is Linking Words
then
, analysed.
All three types of forecasts are prepared for the broadcast. It is obvious that satellite photos provide us with the weather changes in large areas, Linking Words
while
a synoptic chart uses small certain areas, so the forecast will be observed by various sides. Computers or other special equipment receive the up-to-the-minute data and Linking Words
then
transmit it by the TV, radio and recorded announcements as well.Linking Words