
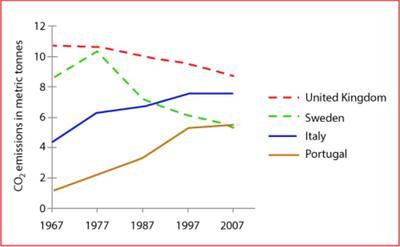
The given line graph illustrates details concerning the average
emissions
per individual of carbon dioxide in the four countries from 1967 to 2007.
Generally, it is obvious witness that the United Kingdom constantly remained the most carbon dioxide Use synonyms
emissions
during the 40 years. What's more, Sweden was the second most country in the first decade but afterwards it became the least Use synonyms
emissions
nation of the four countries.
Use synonyms
Last
but not least, Italy and Portugal were consistently incline their emission in the duration.
Upon closer examination of the data, the United Kingdom emitted over 10 Linking Words
tonnes
per Use synonyms
person
in 1967, after a continuous downward, the Use synonyms
emissions
declined to about 9 Use synonyms
tonnes
per Use synonyms
person
. on the other side, Sweden was 8 Use synonyms
tonnes
per Use synonyms
person
Use synonyms
initially
in 1967, and it soared to 10 after a decade, Linking Words
nonetheless
, it started to drop from 1977 to 2007 with 5 Linking Words
tonnes
per Use synonyms
person
.
Use synonyms
Furthermore
, we can observe that Italy was 4 Linking Words
tonnes
per Use synonyms
person
in 1967 and remained upward in 40 years to be 7 Use synonyms
tonnes
per Use synonyms
person
. Portugal has the same upward curve, it started at 1 ton, ultimately grew to 5 Use synonyms
tonnes
, which is just over Sweden'emission in 2007.Use synonyms