
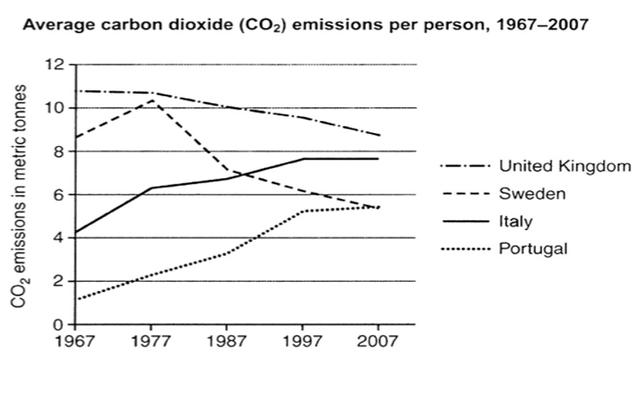
The line chart below shows the average CO2 production for each person in metric
tonnes
in four different countries starting the year 1967 in a 40-year span.
As Use synonyms
it
can be shown from the line chart, In the starting year of 1967 the UK experienced the highest country position among others. Correct pronoun usage
apply
In contrast
, Portugal produced the lowest amount of CO2 Linking Words
emissions
in comparison to the three other countries.
Portugal had shown a significant high rise from below 2 Use synonyms
tonnes
of CO2 production to nearly 6 Use synonyms
tonnes
at the ending point of the illustrated graph. In the same time span number of average person gas Use synonyms
emissions
in the United Kingdom had already been steady and it had been fluctuating around 10 metric Use synonyms
tonnes
per year.
Sweden and Italy were shifting up and down between the UK and Portugal and from 1977 to 2007 showed a dramatic descending rate of Use synonyms
emissions
. In 1977 Sweden showed the highest amount of CO2 production which was above 10 metric Use synonyms
tonnes
Use synonyms
then
experienced a breakout to a steady rate of growth and Italy in almost 7 Linking Words
tonnes
and Use synonyms
finally
recorded the lowest amount of its CO2 Linking Words
emissions
the lowest number for 2007.Use synonyms