
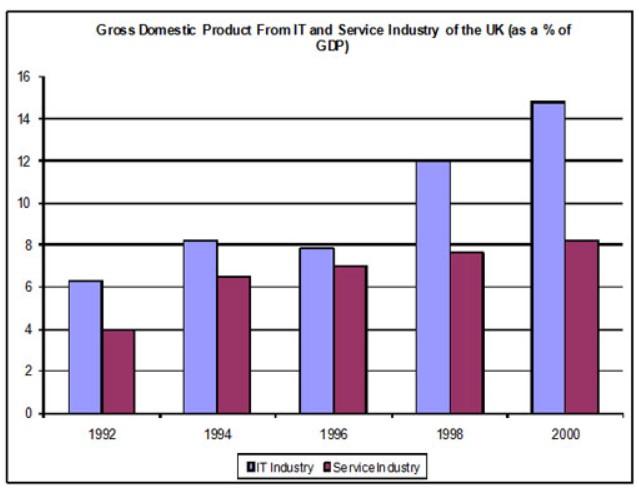
The bar graph presents data on the Gross Domestic Product (
GDP
) generated by the IT and Use synonyms
Service
Industries in the UK from 1992 to 2000.
In general, it is evident that the highest percentage of Use synonyms
GDP
in both IT and the Use synonyms
Service
Use synonyms
Industry
occurred in the final year of the period, with IT consistently outperforming the Use synonyms
Service
Use synonyms
Industry
throughout Use synonyms
this
timeframe.
In 1992, the Linking Words
Service
Use synonyms
Industry
contributed approximately 4% of the Use synonyms
GDP
, Use synonyms
whereas
the IT Linking Words
Industry
accounted for just over 6%. Over the next four years, both sectors witnessed an increase, reaching percentages between 6% and 8%. Despite a decline in Use synonyms
GDP
for IT Use synonyms
after
Linking Words
this
point, it consistently maintained a higher share compared to the Linking Words
Service
Use synonyms
Industry
.
In 1998, there was a substantial surge in the Use synonyms
GDP
of the IT Use synonyms
Industry
, peaking at 12%, Use synonyms
while
the Linking Words
Service
Use synonyms
Industry
only experienced a marginal increase, remaining below 8%. In the final year, the Use synonyms
GDP
for IT nearly doubled that of the Use synonyms
Service
Use synonyms
Industry
.Use synonyms