
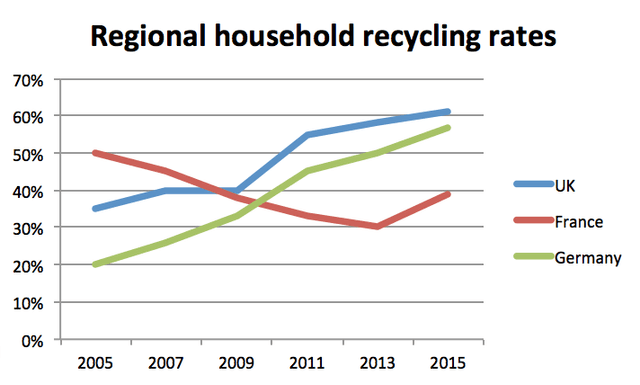
The provided line chart illustrates the rates of household recycling in the
UK
, Use synonyms
France
, and Use synonyms
Germany
over a span of 10 years from 2005 to 2015 by the percentages per year.
Use synonyms
Overall
, after a thorough analysis of the given chart, what can be seen is that recycling rates in both the Linking Words
UK
and Use synonyms
Germany
witnessed a gradual increase over a span of 5 years, Use synonyms
whereas
Linking Words
in
Add the comma(s)
,in
France
, it had decreased by 2015 after being the highest.
In the beginning, from 2005 to 2009, the recycling ratios of both Use synonyms
Germany
and the Use synonyms
UK
Use synonyms
gentle
increased Change the word
gently
around
30% and 40% respectively, whilst in Change preposition
by around
France
, it had dropped to 40% in 2009.
Afterwards, between 2009 and 2015, the recycling proportions in both the Use synonyms
UK
and Use synonyms
Germany
rose roughly to 60% and 55%, respectively, Use synonyms
while
in Linking Words
France
, rates dropped to almost 40% in 2015.Use synonyms