The graphs below show the number of marriages and divorces in the USA between 1970 and 2000. Summarize the information by selecting and reporting the main features and make comparisons where relevant

The graphs below show the number of marriages and divorces in the USA between 1970 and 2000. Summarize the information by selecting and reporting the main features and make comparisons where relevant
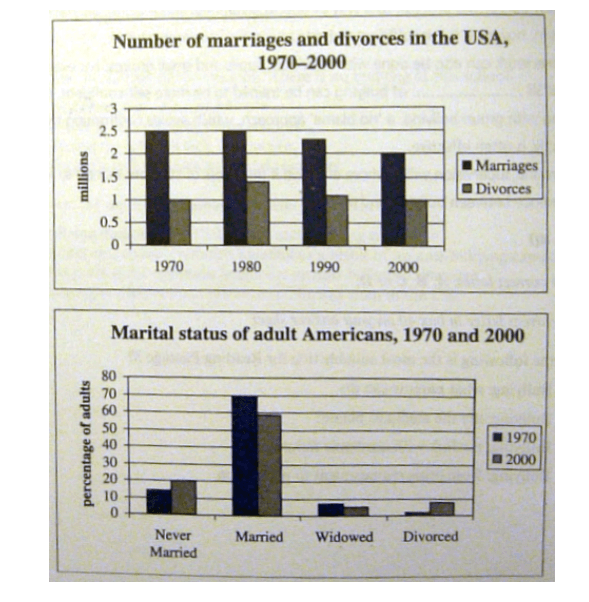
The above graphs provide important insights into the
overall
trend of
marriages
, divorces and various other marital
status
Change the wording
statuses
show examples
of adult Americans in 1970-2000. In regards to
number
Change the article
a number
the number
show examples
of
marriages
and divorces in the USA graph, beginning with
marriages
Change the noun form
marriage
show examples
numbers, the numbers above
illustrates
Change the verb form
illustrate
show examples
a slow yet steady decline,
however
, divorces stayed the same in terms of numbers at around 1 million. That being said, the percentage of divorced Americans
have
Correct subject-verb agreement
has
show examples
increased
due to
the drop in new
marriages
. In the second graph, American people
staying
Wrong verb form
stay
show examples
single by either never getting married, or
reported
Wrong verb form
reporting
show examples
as divorced. Regarding widowed status, it stayed the same
30
Change preposition
for 30
show examples
years
apart
Rephrase
apply
show examples
.
Submitted by saeed953 on

Unauthorized use and/or duplication of this material without express and written permission from this site’s author and/or owner is strictly prohibited. Excerpts and links may be used, provided that full and clear credit is given to Writing9 with appropriate and specific direction to the original content.

Common mistake: Your writing should be 150-250 words.
Vocabulary: Replace the words marriages with synonyms.
Vocabulary: The word "graphs" was used 3 times.
Vocabulary: The word "stayed" was used 2 times.
What to do next:
Look at other essays: