
The
given
pie Verb problem
apply
chart
illustrates Use synonyms
the
Correct article usage
apply
information
about Use synonyms
marriages
and divorces and the Use synonyms
another
Correct quantifier usage
other
chart
describes about marital status of adults in Use synonyms
Americans
, Replace the word
America
the
period between 1970 and 2000.
Change preposition
in the
Overall
, the two chartsLinking Words
portrice
different Correct your spelling
portray
kind
of Fix the agreement mistake
kinds
information
but the Use synonyms
information
city is Use synonyms
same
.
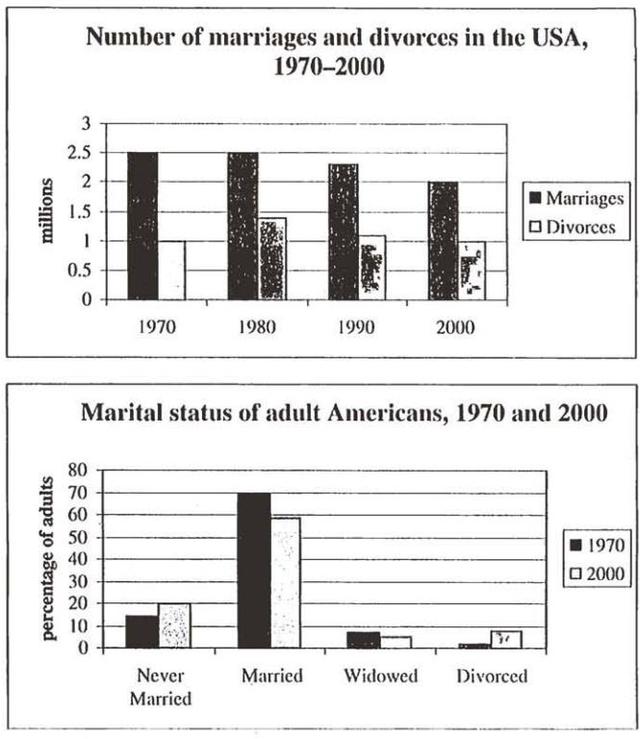
The first Correct article usage
the same
chart
show the Use synonyms
information
about number of Use synonyms
USA
person Correct your spelling
US
get
married and divorced during the period from 1970 to 2000.
Wrong verb form
who got
In the
Change preposition
The
year
1970 and 1980 Fix the agreement mistake
years
show
the same level of Add a comma
,show
marriages
but the divorces Use synonyms
are
variedUnnecessary verb
apply
1
and 1.5 Change preposition
between 1
millons
.And Correct your spelling
million
millions
the
following years Change preposition
in the
of
1990 and 2000 the number of Change preposition
apply
marriages
Use synonyms
take
place Wrong verb form
taking
are
slightly Wrong verb form
was
same
. But the Correct article usage
the same
divoreces
rate face low Correct your spelling
divorce
divorces
Linking Words
while
Correct word choice
when
comparing
to the year 1980.During the period of Wrong verb form
compared
survey
the Add an article
the survey
a survey
year
1980 shows Add a comma
,year
the
high rate of Correct article usage
a
marriages
2.5 Use synonyms
millions
and Change to singular
million
high
rate of divorces 1.5 Correct article usage
a high
millions
.
Now coming to the second Change to singular
million
chart
Use synonyms
it
deliver the Correct pronoun usage
apply
information
about marital status of Use synonyms
americans
Change the capitalization
Americans
of
two years 1970 and 2000. In 1970 the percentage of adults who Change preposition
in
doesn't
get married Wrong verb form
didn't
is
lower than Wrong verb form
was
comparing
to 2000 Change the form of the verb
compared
is
15%and 20%.The Unnecessary verb
apply
Amercians
who get married in their adult age are high in both Correct your spelling
Americans
te
years and the Correct your spelling
the
percentsge
is 70 and 60. The widows and divorced adults Correct your spelling
percentage
are almost shows
the same.Change the verb form
are almost shown