
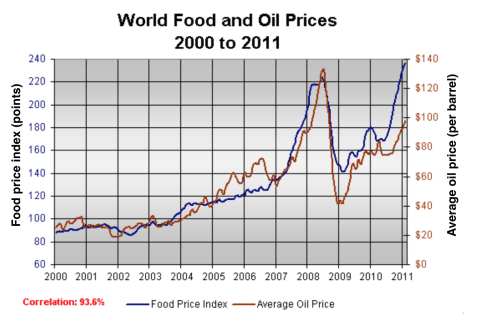
The line graph below illustrates the
cost
of Use synonyms
food
and Use synonyms
oil
over a period of eleven years.The average Use synonyms
oil
and Use synonyms
food
prices are shown per barrel and Use synonyms
points
respectively.
Use synonyms
Overall
, both Linking Words
oil
and Use synonyms
food
prices had inconsiderable ups and downs from 2000 to 2007, but they faced a dramatic rise during Use synonyms
this
period in total. In 2007 a sharp increase started in the Linking Words
food
price index and the Use synonyms
oil
price till they reached 220 Use synonyms
points
and 130 dollars in order during 2008.
Use synonyms
Following
Linking Words
this
, the average Linking Words
oil
Use synonyms
cost
suddenly dropped to 40 dollars and it was the most significant fall in Use synonyms
this
factor over the years. Linking Words
Likewise
, the Linking Words
food
Use synonyms
cost
considerably decreased to 140 Use synonyms
points
in 2009 before a gradual growth in 2010.
In the next year, the Use synonyms
cost
of Use synonyms
oil
rapidly went up to 100 dollars and the Use synonyms
food
Use synonyms
cost
index steeply experienced its highest amount over the period given by nearly 240 Use synonyms
points
.Use synonyms