
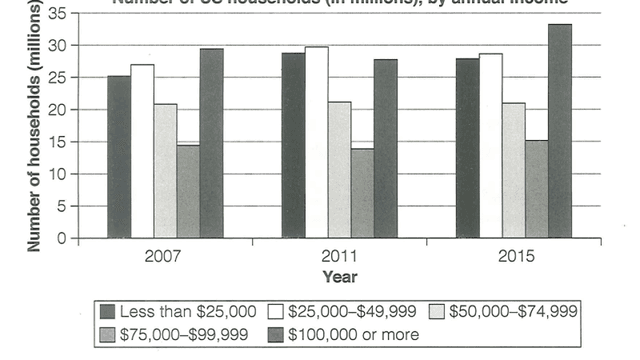
The given bar chart shows how much the annual income that were earned by American
households
in three different years 2007, 20o11, and 2015.
It is apparent that the number of Use synonyms
households
gaining the two highest salaries in 2015 was higher than in other years. Use synonyms
Moreover
, the figures for Linking Words
households
earning 50,000-74,999 Use synonyms
USD
and 75,000-99,999 Use synonyms
USD
(the third and second highest categories) are almost unchanged in all given years.
The first category (Less than 25,000 Use synonyms
USD
) was 25 Use synonyms
million
Use synonyms
households
in 2007 and increased in the next year to around 28 Use synonyms
million
. Use synonyms
However
, it slightly fell to about 27 Linking Words
million
. The number of Use synonyms
households
who get annual income in the second category (25--,000-49,999 Use synonyms
USD
) was around 27 Use synonyms
million
in the first year and experienced a slight increase to almost 30 Use synonyms
million
. Use synonyms
Nevertheless
, it decreased to about 28 Linking Words
million
.
The figures for Use synonyms
households
gaining salary in the third and fourth categories (500,000-74,9999 and 75,000-99,999 Use synonyms
USD
) almost remained. The number of Use synonyms
households
getting the highest salary or the fifth category (100,000 Use synonyms
USD
or more) was almost 30 Use synonyms
million
in 2007 and experienced a down-trend at around 27.5 Use synonyms
million
. Use synonyms
However
, it rocketed Linking Words
at the end
of the period to over 37 Linking Words
million
.Use synonyms