
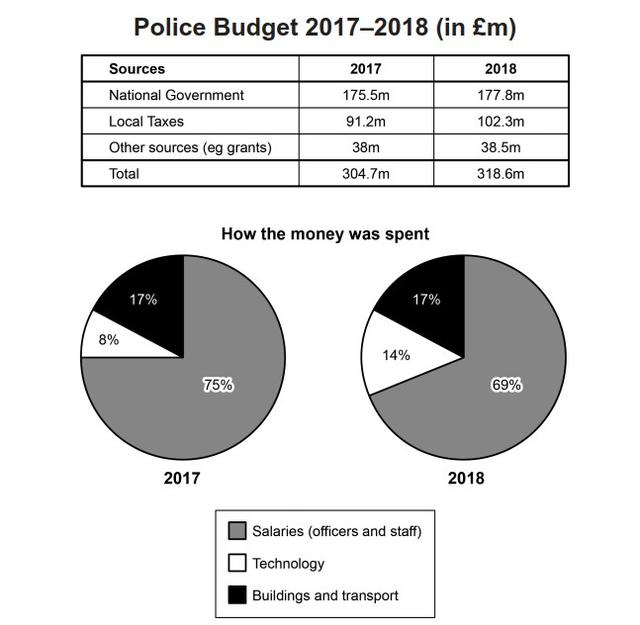
The table and the charts illustrate the budget for police in 2017 and 2018 in a region of Britain. The table shows the origin of the fund and the charts show how it was divided.
From a glance, most the
amount
of the money came from the National Government, Local Taxes were the second contributors and other resources gave the least in both 2017 and 2018. Use synonyms
Moreover
, the Salaries fund received the highest total of money and the lowest proportion was technology, and the spending on Buildings and transport was the second.
Linking Words
Firstly
, in the table, the sources of the budget came from many organisations. It was noticeable that the funding Linking Words
amount
of the National government had a very minimal change during 2017 and 2018. In 2017 to total Use synonyms
amount
was $175.5m and it slightly increased to $177.8m in 2018. Use synonyms
Similarly
, other sources provided the lowest number of cash and it hardly did not go up which was $38m in 2017 and $38.5m in 2018. Even though local taxes added a smaller Linking Words
amount
than the National Government, it had a significant expansion from $91.2 Use synonyms
m
in 2017 to $102.3 in 2018. In total, the sum of the budget’s fund had a dramatical change beginning with $304.7m and ending with $318.6m in 2018
It was clearly to be seen that most of the budget was spent on Salaries and it had a remarkable reduction from 75% in 217 to 69% in 2018. Use synonyms
In addition
, the provision for building and transport kept the same proportion at 17% in both years. Linking Words
Nonetheless
, the investment in technology was increasing dramatically from 8% in 2017 to 14% in 2018.Linking Words