
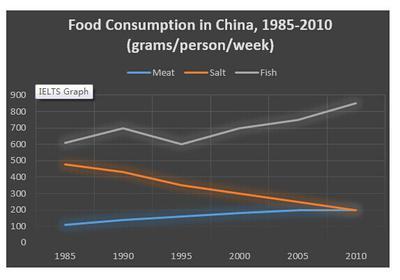
The line graph illustrates how many
grams
of food were consumed by Chinese citizens between the Use synonyms
years
of 1985 to 2010. Use synonyms
Overall
, a huge amount of people have preferred to eat fish rather than meat and salt over the Linking Words
years
.
Use synonyms
To begin
, In the given periods, Chinese people were eating three famous foods Linking Words
such
asLinking Words
,
meat,salt and fish.Remove the comma
apply
Firstly
, fish started to consume 600 Linking Words
grams
in 1985. Use synonyms
This
range peaked at 700 groms after five Linking Words
years
. suddenly, it declined to 600 Use synonyms
grams
and again it achieved its previous target. Use synonyms
In addition
, people's consumption level gradually increased to around 800 Linking Words
grams
in 2005, followed by 2010 the count continuously reached higher and higher range consumption at over 900 Use synonyms
grams
.
when looking at the remaining foods,
salt contents typically start to decrease from 500 Use synonyms
grams
in the beginning. The range slowly fell to 300 Use synonyms
grams
in 2000, it dropped to 200 Use synonyms
grams
in the end. Meat was the least preferred food by them. It accounted for only 100 Use synonyms
grams
and it ended at 200 Use synonyms
grams
of consumption over the twenty-five Use synonyms
Years
.Use synonyms