
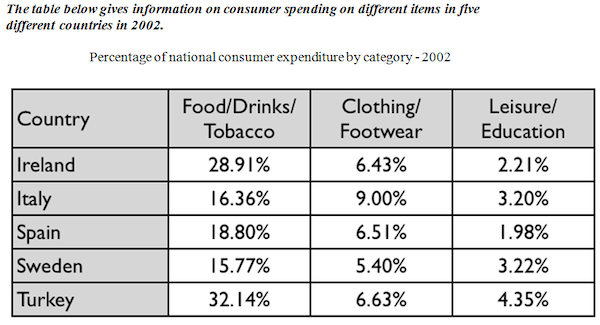
The provided diagram illustrates the proportion of goods that customers from five countries, Ireland, Italy, Spain, Sweden and Turkey throughout 2002.
From an
overall
perspective, it is noticeable from the table that every country in the given report has a majority demand for the categories of eatable products followed by fashions Linking Words
then
education at the bottom line.
Observing the details, it is remarkable that Ireland, Italy, Spain, Sweden and Turkey have Linking Words
their
most interest Change the word
the
on
food at approximately 28.91%, 16.36%, 18.80%, 15.77% and 32.14% respectively. Change preposition
in
Similarly
, clothing and footwear Linking Words
at
roughly 6.43%, 9.00%, 6.51%, 5.40% and 6.63% followed by educational services respectively. Interestingly, all of the five nations tend to have the least favourable on education which remained at the lowest levels.
To summarise, with what has been analysed and compared, it is crucial to highlight that eatable goods are more present in modern society than fashions and institution systems.Add a missing verb
are at