
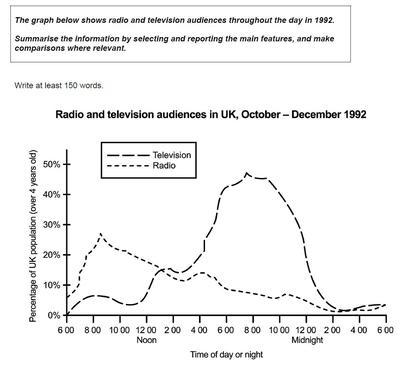
The line graph provides information about the proportion of UK citizens watching TV or listening to the radio and
also
data on what time it was in 1992.
Linking Words
Overall
, it is clear to see that the most popular radio and television Linking Words
hours
were 8 am and about 8 pm respectively.
Looking at the short-dot line, we can see that approximately 20 per Use synonyms
cent
of people started listening to audio programs mostly from 7 o'clock and the percentage reached a peak of 28 per Use synonyms
cent
at 8 in the morning. Use synonyms
Nevertheless
, the figure was steadily decreasing during the next 22 Linking Words
hours
.
If we take a look at the long-dot line, it can be noted that the percentage of citizens fluctuated around 5 a.m. during the first 3 Use synonyms
hours
in the morning. During the next 8 Use synonyms
hours
of the Use synonyms
,
day the figure grew until it reached a peak of 50 per Remove the comma
apply
cent
at 8 o'clock. Use synonyms
However
, there was a dramatic fall of 45 per Linking Words
cent
by the beginning of the next morning.Use synonyms