
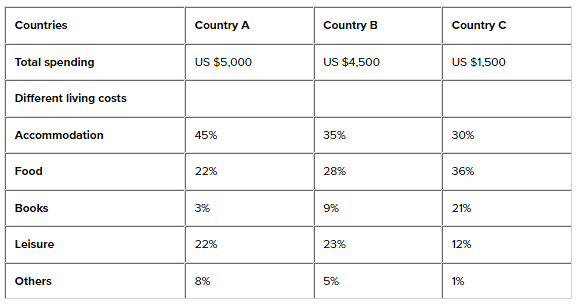
The given table compares the percentage of expenditure which college disciples from 3
countries
spend on different living expenses each year.
Use synonyms
Overall
, the total spending of disciples in Linking Words
country
A was higher than the expenditure of scholars in Use synonyms
countries
Use synonyms
B
and Use synonyms
C
. In all the Use synonyms
countries
, scholars spent the highest proportion of their budget on accommodation and food.
In agrarian A, the total spending of pupils is highest, at 5000$ per year, compared with $4500 and $1500 for disciples in Use synonyms
countries
Use synonyms
B
and Use synonyms
C
respectively.
Accommodation accounts for 45% of the total expenditure of students in provincial A, Use synonyms
while
the proportions were lower for pupils in Linking Words
country
Use synonyms
B
at 35%, and Use synonyms
country
Use synonyms
C
, at only 30%. Use synonyms
However
, in terms of food, learners in Linking Words
country
Use synonyms
C
spend the largest percentage of their money on it, accounting for 36%. The figures for Use synonyms
countries
A and Use synonyms
B
are only 22% and 28% respectively. apprentices in Use synonyms
country
Use synonyms
C
Use synonyms
also
spent a high rate of their budget on books, at 21%, compared with 9% for apprentices in Linking Words
country
Use synonyms
B
and just 3% for learners in Use synonyms
country
A. Use synonyms
By contrast
, students in regions A and Linking Words
B
spent 22% and 23% respectively of their budget on leisure, as students in coun.try Use synonyms
C
spent only 12% of their total money on Use synonyms
this
categoryLinking Words