
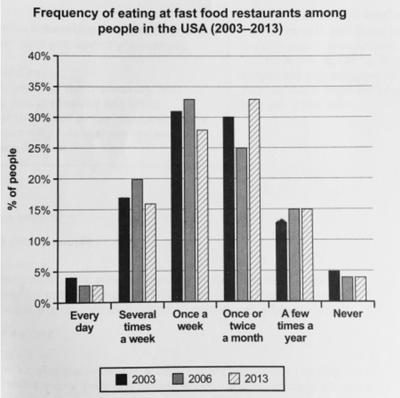
The given bar chart illustrates the frequency of
Americans
habit of eating in fast Change noun form
Americans'
American's
food
Use synonyms
restaurants
between 2003 and 2013.
Use synonyms
Overall
, Linking Words
it is clear that
the proportion of Linking Words
people
who ate junk Use synonyms
food
at least once a week was the most in the year 2006. Use synonyms
Moreover
, there is an interesting similarity between the proportion of Linking Words
people
who eat fast Use synonyms
food
every day and those who are not interested in junk Use synonyms
food
at all.
As we can see, around 33% of US citizens consumed fast Use synonyms
food
one time a week in 2006. A similar data was true for Use synonyms
people
who went to fast Use synonyms
food
Use synonyms
restaurants
once or twice a month in the year 2013. The figure for junk Use synonyms
food
lovers in 2003 was 31% for once-a-week attendees and 30% for once or twice-a-month attendees.
Another interesting point is related to data for everyday fast Use synonyms
food
eaters and Use synonyms
people
who never went to Use synonyms
such
Linking Words
restaurants
from 2003 and 2013. Both figures show us less than 5% of American Use synonyms
people
like to eat a meal in fast Use synonyms
food
Use synonyms
restaurants
every day and Use synonyms
this
data for citizens who never wanted to taste fast Linking Words
food
is just under 5% for all 3 years which is shown in the bar chart.Use synonyms