
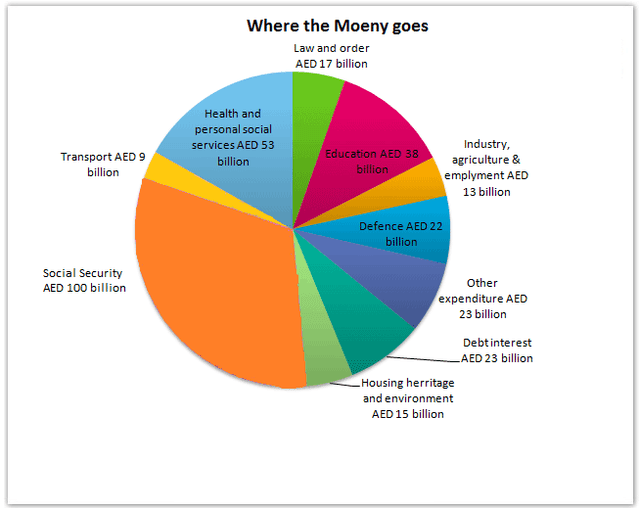
The pie chart illustrates the expenditure of the UAE
government
in 2000 with the limit of AED 315 Use synonyms
billion
.
Use synonyms
Overall
, social security is the category Linking Words
that is
spent most Linking Words
while
Linking Words
transportation
is the least funded by local authorities.
As seen in the pie chart, the two categories with the highest spending from the Use synonyms
government
are social security with AED 100 Use synonyms
billion
and personal and health services with AED 53 Use synonyms
billion
. Use synonyms
This
indicates the areas of focus and importance the Linking Words
government
would spend on.
Use synonyms
On the contrary
, the areas with the least expenditure from local authorities are Linking Words
transportation
and industrial or agricultural employment. These two categories received the lowest spending of AED 9 Use synonyms
billion
for Use synonyms
transportation
and AED 13 Use synonyms
billion
for employment. From the pie chart, it can be inferred that Use synonyms
transportation
and employment is not Use synonyms
a
significant concern in the UAE Correct article usage
apply
due to
the lack of attention the Linking Words
government
has based on spending.Use synonyms