
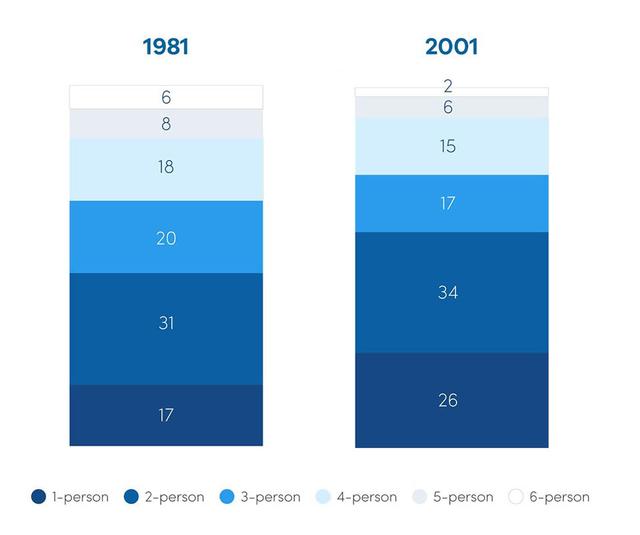
The bar chart provides information on each UK Family’s demographic numbers from 1981 and 2001.
Overall
, a family with two Linking Words
members
was calculated as the highest of both periods Use synonyms
while
the big family was the least.
Linking Words
According to
the data, in 1981 about 31 British households Linking Words
counted
had 2 family Verb problem
apply
members
in each family; Use synonyms
however
, those who were in a single family and 3 - 4 Linking Words
members
shared almost similar numbers (17-20). Use synonyms
On the other hand
, the nuclear family was found not popular around the country, which is just merely under 10.
Linking Words
Furthermore
, in 2001 the number of the single-family rose slightly to 26. Linking Words
Likewise
, for those with 2 family Linking Words
members
which in 1988 counted by 31 Use synonyms
then
decreased to 34. Linking Words
In contrast
, the figure for the extended family fell significantly by about 5- 17 and the number of 5 to 6 persons family Linking Words
members
Use synonyms
also
plummeted to under 5 households.Linking Words