
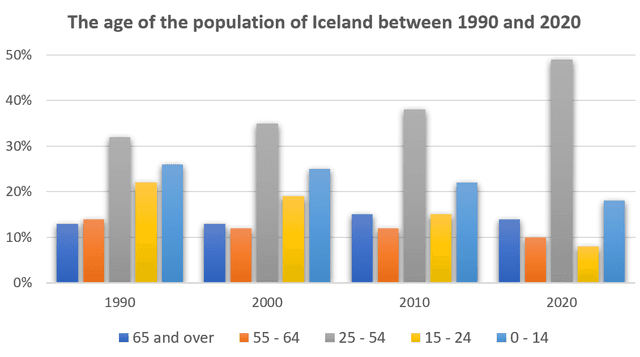
The bar chart depicts data about the percentage of Iceland's population
age
over a 32-year period, starting from 1990.
In general, it can be seen that the proportion of adult people was the highest than any other Use synonyms
age
over the period shown.
Upon closer examination of the data, it is evident that the population of Iceland country over 65 remained constant between 1990 and 2000. But they rose to 14% in 2020. Use synonyms
In contrast
, The Linking Words
age
of 55-64 group percentage fluctuated, Use synonyms
such
as 13% in 1990, 12% in 2000 Linking Words
then
increased to 15% in 2010 Linking Words
whereas
it dropped to 14% in 2020.
Taking a closer look at the remaining data, it is shown that the Adult Linking Words
age
group increased dramatically from 1990 to 2020, at about 32% to 49%. The figure for the 15-24 and 0-14 group ages decreased in population, which is 31%, 21% in 1990 and 8%, 18% in 2020.Use synonyms