The graph below shows the qatari import totals( in tons) for several types of vegetables from 1980 to 2020.

The graph below shows the qatari import totals( in tons) for several types of vegetables from 1980 to 2020.
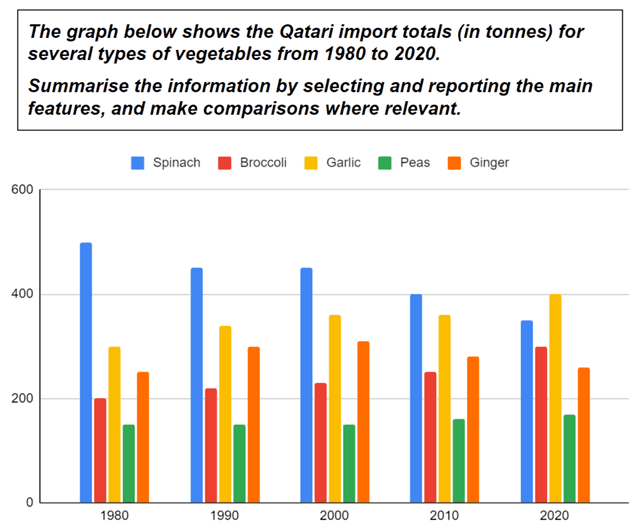
The pie charts depict the total value of
imports
in Qatar for five varieties of vegetables for 3 distinct years from 1980 to 2020. Units are denoted in
tonnes
.
Overall
, in 1980 and 2000,
spinach
dominated
imports
as opposed to 2020.
Additionally
, in all 3 years, at least 150
tonnes
of produce was brought in from other countries, across all items.
Moreover
, garlic, broccoli and peas exhibited upward trends, as opposed to
spinach
which declined gradually and ginger, which showed a fluctuation.
Spinach
was attributed to being the highest at 500
tonnes
in 1980 and fell by 50
tonnes
in 2 decades, but continued to be the pinnacle of
imports
in the year 2000 as well. In 2020
however
, garlic
imports
surpassed that of
spinach
, to be the maximum at 400
tonnes
.
Furthermore
, garlic was the second most preferred vegetable in 1980 and 2000 at 300 and 360
tonnes
respectively. Peas was the least in all years and remained more or less the same which was recorded to be 150
tonnes
.
Submitted by pasankonagama on

Unauthorized use and/or duplication of this material without express and written permission from this site’s author and/or owner is strictly prohibited. Excerpts and links may be used, provided that full and clear credit is given to Writing9 with appropriate and specific direction to the original content.

Vocabulary: Replace the words imports, tonnes, spinach with synonyms.
Vocabulary: Rephrase the word "undefined" in your introduction.
What to do next:
Look at other essays:
  • An increasing number of individuals today prefer to use a global language such as English to communicate instead of opting for native tongues throughout the World as different countries become closer to each other due to the development of transportation mediums. Some people think that it will be a threat to the local languages. Although it has some minor risks, I can not entirely agree with this thought and will discuss my point of view.
  • students at graduation level are prominently selecting studying at an international university as part of their academic learnings. Although selecting international universities can give a short-term feeling of homesickness and disconnection from family and friends back there in their country it creates opportunities such as finanacial independence, greater employment opportunities and global exposure about the selected subjects.
  • Nowadays, along with the thriving development of advanced technology, every people possesses mobile devices such as smartphones or tablets, and children are no exception. So it is likely for them to stick their eyes to the screen for many hours which can severely affect the well-being of children physically and mentally. In my opinion, this tendency is a bit of a negative development.
  • In this modern time, the overall health and well-being of the residents are declining in huge urbanized communities. There are various reasons for this trend as well as actions that may be proposed to mitigate this.
  • The bar chart presents the population of Iceland between 1990 to 2020 differentiated by age groups. Each age group is shown by a different bar color. The difference is counted in percent. Overall, we see a steady increase in the largest popupation of the age group 25-34 years. In the contrary, the children and adulecence groups are fewer for each year measured. Interestingly, the only group that has a more or less stable population rate, is the group 65+. Even though the age group of young adults was the largest with about 30% in year 1990, is has had a overwelming increat to about 50% in 2020 leaving a huge gap to the other age groups. As for the oldest age, it was a slight fluctuation between 12 and 15%, during the same 30-year period, ending with 14% in 2020. The other groups had all a negative trend, including the children group, the adulecence group and the age group between 55-64 years. Despite the decline, the second largest group was always the youngest group at alle measure...