The pie chart below shows a frequance of US adult's online purchasing habits in 2015, while the bar chart shows a further classification denoting online purchasing preferances.

The pie chart below shows a frequance of US adult's online purchasing habits in 2015, while the bar chart shows a further classification denoting online purchasing preferances.
IELTS Writing Task Chart for The pie chart below shows a frequance of US adult's online purchasing habits in 2015, while the bar chart shows a further classification denoting online purchasing preferances.
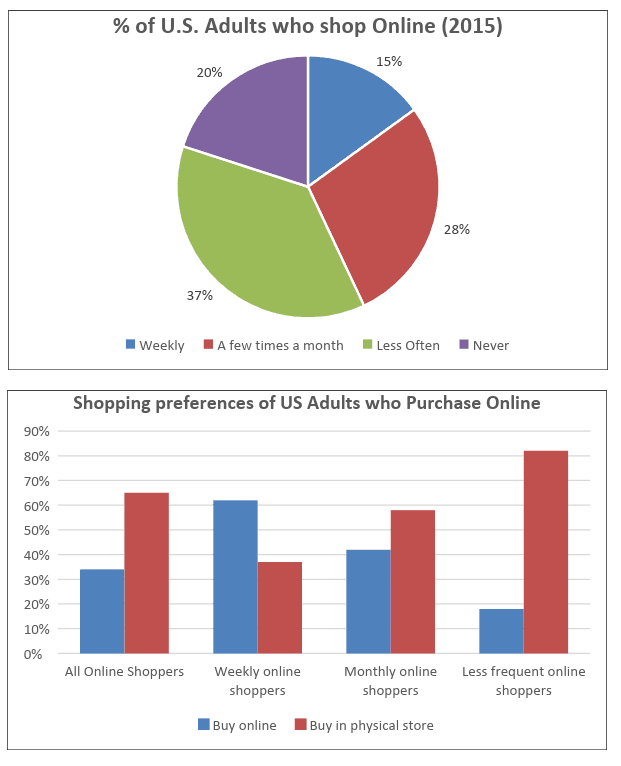
The two charts (pie and bar) present information measured in proportion about the habits of American adults who frequently bought online in 2015 and a
further
Linking Words
grouping and denoting online shopping favourites.
Overall
Linking Words
, in the pie chart, Adults were dominant in less often spending money on online shops and the
last
Linking Words
one was weekly.
Additionally
Linking Words
, in the column chart, the physical store is almost dominant in 4 categories of
shoppers
Use synonyms
.
To begin
Linking Words
with, in 2015, Adults from the U.S. less often spent money on online shops with a percentage of 37%, and people who a few times per month shopped on online shops with 28%. 20% of them never purchased online,
while
Linking Words
15% grown people bought online shop.
In addition
Linking Words
, regarding preferences, the physical store is supreme with approximately 80% of less frequent online buyers, above 60% of all online
shoppers
Use synonyms
, and below 60% of monthly
shoppers
Use synonyms
preferring to buy from it. Meanwhile, about 60% of weekly online
shoppers
Use synonyms
choose to buy online.

Unauthorized use and/or duplication of this material without express and written permission from this site's author and/or owner is strictly prohibited. Excerpts and links may be used, provided that full and clear credit is given to Writing9 with appropriate and specific direction to the original content.

Sentences: Add more complex sentences.
Vocabulary: Replace the words shoppers with synonyms.
Vocabulary: The word "charts" was used 3 times.
Vocabulary: The word "about" was used 2 times.
Topic Vocabulary:
  • pie chart
  • bar chart
  • percentage
  • illustrate
  • engaged
  • preferences
  • category
  • products
  • popular
  • demographics
  • convenience
  • variety
  • shopping behavior
  • technological advancements
What to do next:
Look at other essays: