
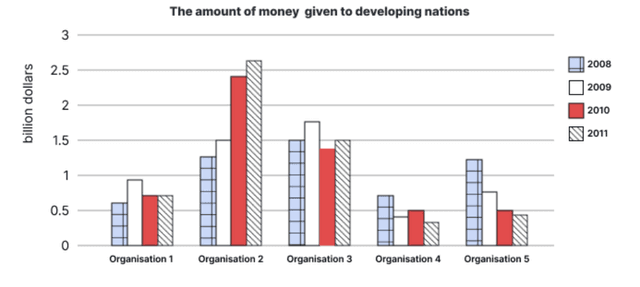
The bar chart indicates the number of donations from five non-profit organizations to developing countries from 2008 until 2011.
Overall
, it can be seen that the amount of resources that these organizations provide differs in terms of the quantity of the funds and the patterns from Linking Words
year
to Use synonyms
year
period.
Use synonyms
Firstly
, Linking Words
organization
2 submitted the biggest share of money to third-world countries, from above one Use synonyms
billion
Use synonyms
dollars
in 2008 to more than 2,5 Use synonyms
billion
Use synonyms
dollars
in a four-Use synonyms
year
span. Use synonyms
In contrast
to other committees, only Linking Words
Organization
2 committed to raising their contributed funds.
Use synonyms
Secondly
, Linking Words
Organization
3 ranks second by around 1,5 Use synonyms
billion
Use synonyms
dollars
per Use synonyms
year
offered to the nations, followed by Use synonyms
Organization
1 approximately 2 Use synonyms
billion
Use synonyms
dollars
in total. These two organizations have similar patterns of a stagnated graph of donated funds, Use synonyms
while
the other agencies have lowered their contributions to low-income countries by as low as 500 million Linking Words
dollars
in the Use synonyms
last
Linking Words
year
of the chart.Use synonyms