
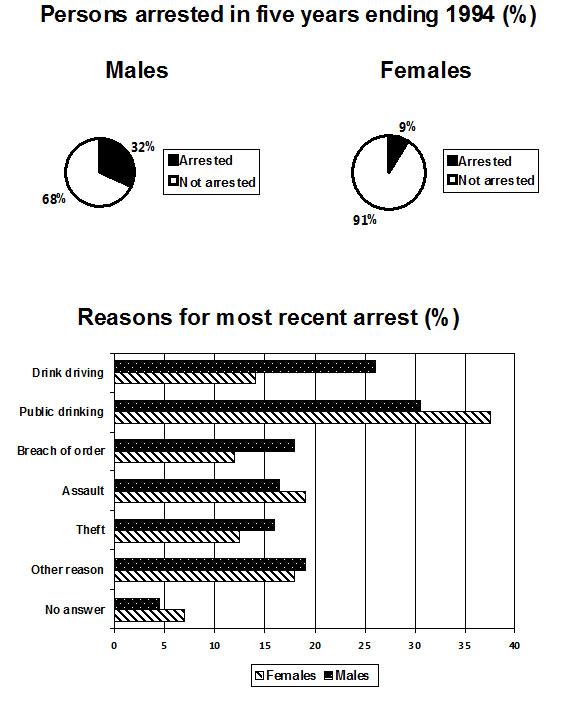
This
pie chart illustrates the proportion of individuals who have been arrested through the five years until the Linking Words
last
day of 1994. The table graph depicts several different habits that lead people to get arrested. It is clear from the graphs above that Linking Words
females
have lower percentages than males. Use synonyms
However
, when it comes to the Linking Words
reasons
for getting arrested, women have the highest score, approximately 38%.
Use synonyms
According to
what is shown, among all the Linking Words
reasons
, men have more countable causes than Use synonyms
females
, 4 to 3 respectively. Use synonyms
Furthermore
, public drinking has an enormous percentage all over other Linking Words
reasons
. Use synonyms
On the other hand
, no answer was the lowest ranking for both genders. Linking Words
Also
, we can realize that other reason is quite similar and has almost the same ratio of nearly 18%.
In terms of fact, Linking Words
females
were more disciplined and least path to crimes. Use synonyms
As a result
, they reached 91% of not-arrested, but ultimately, males got 68%.
Linking Words
To sum up
, we could say that, men have a significant proportion of getting caught by police and Linking Words
overall
, they have more Linking Words
reasons
as well. Despite having the largest percentage in a special situation for Use synonyms
females
( Public Drinking ), they are less attracted for a number of Use synonyms
reasons
.Use synonyms