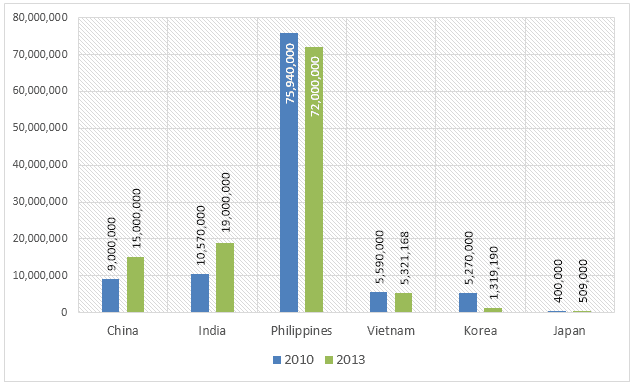
The graph below gives information about the number of Catholics residing in different nations, during 2010-2013. Summarise the information by selecting and reporting the main features, and make comparisons where relevant
IELTS Writing Task Chart for The graph below gives information about the number of Catholics residing in different nations, during 2010-2013. Summarise the information by selecting and reporting the main features, and make comparisons where relevant
Unauthorized use and/or duplication of this material without express and written permission from this site's author and/or owner is strictly prohibited. Excerpts and links may be used, provided that full and clear credit is given to Writing9 with appropriate and specific direction to the original content.
Sentences: Add more complex sentences.
▼
Linking words: Add more linking words.
▼
Basic structure: Write more paragraphs.
▼
Basic structure: Add more body paragraphs.
▼
Common mistake: Your writing should be 150-250 words.
Basic structure: Write more paragraphs.
▼
Vocabulary: Only 6 basic words for charts were used.
In the contemporary era, crime is a serious problem, and there are many arguments on how to reduce the number of criminals. A range of individuals think that a longer period of prison sentences will solve this issue, meanwhile, their counterparts do not agree and argue that there are other better ways to reduce the crimes. Two aforementioned views will be discussed thoroughly in the following paragraphs before presenting my perspective in the conclusion.
have been too weak to the environmental criminals these days, resulting in the increase of problems such as climate change. I think the governments should tighten the regulations and the punishments to scare them.
Nowadays, some youngsters choose to engage in various jobs after senior high school while others decide to go further in their studies. Everyone opts for the plans that are suitable for them according to their circumstances.
I hope you’re doing well! I wanted to share some exciting news with you—I’ve recently started a new job at [Company Name]. It was a tough decision to leave my previous role, but I was looking for better career growth and new challenges, and this opportunity seemed perfect.
These days, people rely on electronic devices to gain information due to their convenience, such as free materials. Therefore, some believe that in the near future, there is no more urgency to buy paper-based books, magazines, or newspapers. I agree with the view as I believe that technology brings a number of benefits compared to the traditional method.