
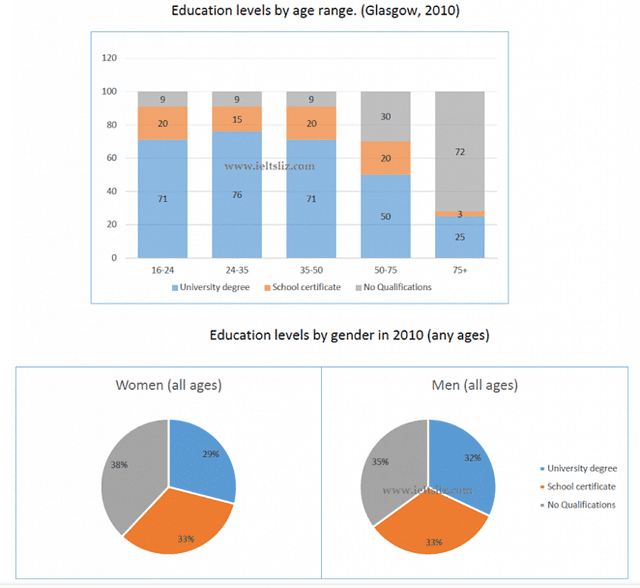
The bar and pie graphs depict the degree of the standard education categorised by
age
and gender in Glasgow, Scotland, in 2010. Use synonyms
Overall
, approximately three-quarters of those under the Linking Words
age
of 50 had tertiary education and roughly one-third of the men and the women were divided into three different educational levels.
Use synonyms
Firstly
, looking at the bar graph, Linking Words
it is clear that
more than 70% of the Linking Words
age
among 16-50 were qualified university degree and 20% of those under 75 finished their Use synonyms
school
education, except those aged 24-35, only 15% of those acquired a certificate from Use synonyms
school
. Use synonyms
In contrast
, university degrees in those over 75 made up only a quarter of the total, Linking Words
while
non-qualifications accounted for over three-quarters of the total and the Linking Words
number
of Use synonyms
school
certificates was the least (3%) in Use synonyms
this
Linking Words
age
group. In terms of non-qualification, there was the lowest Use synonyms
number
in the Use synonyms
age
under 50 at 9%, Use synonyms
while
the Linking Words
number
of no-qualification positively correlated to the Use synonyms
number
of ageing in over 50.
Use synonyms
Secondly
, Linking Words
according to
the data given in the pie chart, almost over a third of both genders had a Linking Words
school
or university qualification, and Use synonyms
also
non-qualification people in both genders accounted for the highest proportion at 38% in women and 35% in men.
Linking Words
To sum up
, it is obvious that the younger Linking Words
age
groups under 50 had a higher degree and there was not much difference among the genders as regard to the figure for educational levels.Use synonyms