
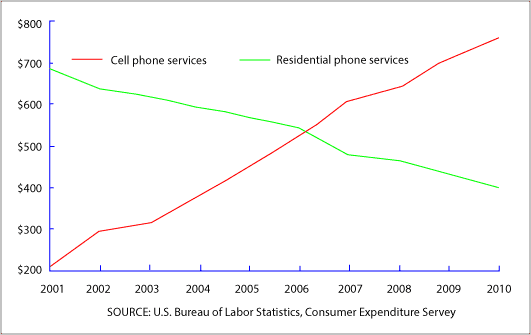
The chart provides information about the yearly average spending on three kinds of communication
services
of the US people from 2001 to 2010.
Use synonyms
Overall
, there was an increase in the expenditure for cell phones and international fixed-line Linking Words
services
, with cell phones witnessing a dramatic growth to become the most attractive one from 2006 onwards. Meanwhile, the figure for the annual cost of national fixed-line Use synonyms
services
underwent a constant decline throughout the period.
In 2001, every US consumer paid about 200 Use synonyms
USD
for mobile Use synonyms
services
, followed by a rapid expansion to exactly 500 Use synonyms
USD
in 2006 and continuously climbed to just over 720 Use synonyms
USD
Use synonyms
at the end
of the stage examined. A similar change, but to a lesser extent, was seen in the amount spent Linking Words
into
worldwide amenities, which started at 250 Change preposition
on
USD
in 2001 and reached approximately 300 Use synonyms
USD
after 10 years.
Use synonyms
Conversely
, at the beginning of the given duration, per US user expended 700 Linking Words
USD
in domestic fixed-line utilities, after which it experienced a gradual decrease before ending at around 400 Use synonyms
USD
in 2010.Use synonyms