
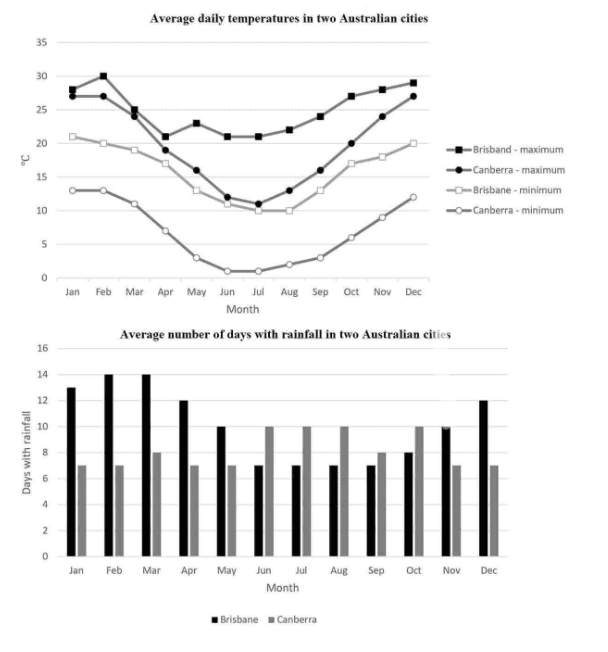
The graph below illustrates the median of everyday maximum and minimum mercury in degrees
celsius
, Capitalize word
Celsius
while
the chart gives information about the average amount of Linking Words
rainfall
in 12 months for Use synonyms
Brisbane
and Use synonyms
Canberra
.
Use synonyms
Overall
, it clearly shows the highest temperature in Linking Words
Brisbane
occurs in February Use synonyms
along with
the Linking Words
rainfall
ratio, Use synonyms
as well as
for the heat in Linking Words
Canberra
, it happened in February too, Use synonyms
while
the Linking Words
rainfall
mostly came about between June and August.
Use synonyms
To begin
with, the beginning of the year can be said as the hottest weather in Linking Words
Brisbane
. Use synonyms
This
can be looked at as in January the temperature started Linking Words
with
28 Change preposition
at
celsius
, touching 30 Capitalize word
Celsius
celsius
in February. The Capitalize word
Celsius
rainfall
Use synonyms
also
dominates between January to March, almost 2 weeks of each month. Linking Words
Canberra
itself has Use synonyms
similarity
with Fix the agreement mistake
similarities
Brisbane
in degree, yet the Use synonyms
rainfall
is not frequent, Use synonyms
only
7 - 8 days rain wetting Change preposition
with only
Canberra
in the first quarter of the year.
Starting winter, from May to August, the temperatures are at their lowest both in Use synonyms
Brisbane
and Use synonyms
Canberra
. Use synonyms
However
, in Linking Words
Canberra
, rain often falls between June and August, about 10 days per month.Use synonyms