
n
Correct your spelling
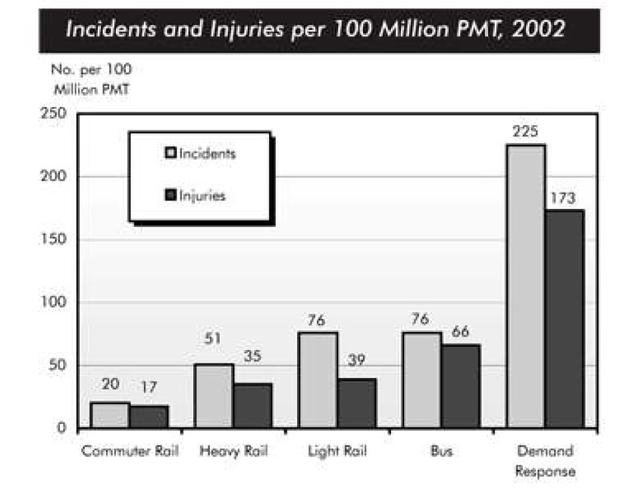
In
this
bar graph, illustrations of the figured Linking Words
incidents
and Use synonyms
injuries
in every 100 million commuter miles traveled by transportation modes which include commuter Use synonyms
rail
, heavy Use synonyms
rail
, Use synonyms
light
Use synonyms
rail
, Use synonyms
bus
, and demand response in the year 2002 are reflected. Use synonyms
Overall
, the vast majority of Linking Words
incidents
and Use synonyms
injuries
are seen in the demand response type of transportation.
Noticeably, the commuter Use synonyms
rail
is reported to have the least number of Use synonyms
incidents
and Use synonyms
injuries
per 100 million passenger miles Use synonyms
traveled
. Change the spelling
travelled
While
the Linking Words
light
Use synonyms
rail
and the Use synonyms
bus
had an equal number of Use synonyms
incidents
, the Use synonyms
injuries
for the Use synonyms
bus
mode of transport were greater than for the Use synonyms
light
Use synonyms
rail
. Use synonyms
Nevertheless
, riding on the Linking Words
bus
could cause more damage to passengers than using the Use synonyms
light
Use synonyms
rail
. As for the heavy Use synonyms
rail
, the incident showed 50 per 100 million PMT and the Use synonyms
injuries
comprised 75% of the total Use synonyms
incidents
.
Use synonyms
Therefore
, the Linking Words
incidents
and the number of Use synonyms
injuries
in the demand response should be addressed and solutions must be created to avoid Use synonyms
further
damage to people.Linking Words