
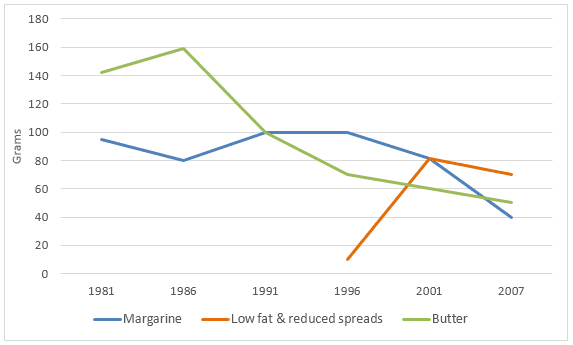
The line chart displays the usage of three spreads for bread, there are
margarine
, low fat & reduced spreads, and Use synonyms
butter
, from 1981 to 2007 per five years. Use synonyms
Overall
, their trends fluctuate but they tend to fall Linking Words
at the end
of year range.
Starting in 1981 with around 90 Linking Words
grams
Use synonyms
margarine
had lower Use synonyms
consumption
than Use synonyms
butter
which had around 50 Use synonyms
grams
over it. In the following 5 years, Use synonyms
butter
reached a peak with almost 160 Use synonyms
grams
of usage. Use synonyms
Besides
Linking Words
margarine
Use synonyms
consumption
declined by about 10 Use synonyms
grams
. Interestingly, in 1991 Use synonyms
margarine
and Use synonyms
butter
were consumed in similar amounts, around 100 Use synonyms
grams
, where Use synonyms
butter
sharply plummeted and Use synonyms
margarine
went up. In 1996 a new spread variant appeared, low fat and reduced spreads, with around 10 Use synonyms
grams
Use synonyms
consumption
at initial. At that time, Use synonyms
margarine
became the most common spread to eat. In 2001, low fat & reduced spreads ate the same as Use synonyms
margarine
. Use synonyms
Then
, in 2007 three of them plunged with Linking Words
consumption
for each spread: 40 Use synonyms
grams
Use synonyms
margarine
, 50 Use synonyms
grams
Use synonyms
butter
, and 70 Use synonyms
grams
low fat and reduced spreads.Use synonyms