
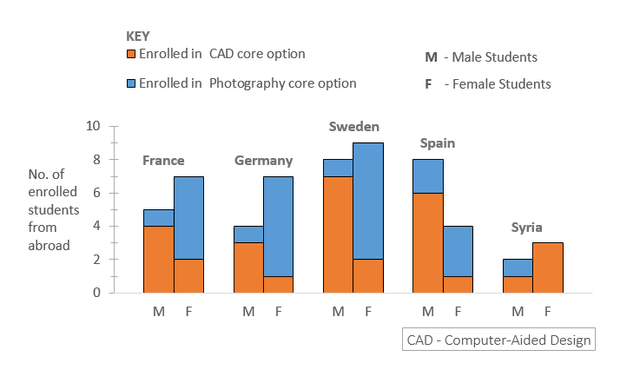
The bar chart vividly depicts the number of male and female students enrolled in two various country graphic design courses at colleges in South of England from France, Sweden, Germany, Spain and
Syria
.
From the Use synonyms
overall
analysis, it is readily apparent that the majority of Linking Words
males
preferred to take admission in Computer-aided design Use synonyms
whereas
, Linking Words
females
chose photography in most Nations. Surprisingly, in Use synonyms
Syria
Use synonyms
females
only enrolled in photography and Use synonyms
males
had an equal sum of admission in both courses.
By scanning the details, enrollment in CAD, in France figure of entrance were 4 in male and 2 in female similar trend was observed in Germany 3 and 1 respectively. Use synonyms
Moreover
, the statistic for male students was threefold that of female students in Sweden Spain has a significant difference in sum 6 in Linking Words
males
and only one in Use synonyms
females
. Use synonyms
On the other hand
, in Linking Words
Syria
counterpart to Use synonyms
this
train, the total enrollment doubled for Linking Words
females
as compared to Use synonyms
males
.
Use synonyms
Furthermore
, photography core option, France, Germany and Sweden illustrate a similar trend in which the sum of Linking Words
females
was twice and thrice in comparison to men. In Spain, the numbers were slightly the same for both genders. Interestingly, in Use synonyms
Syria
, women were not interested in look confirmation and only one male was enrolledUse synonyms