
The graph below gives information
the
outcome of the survey. The first graph compares the total percentages that Change preposition
on the
decide
to Wrong verb form
decided
study
divided Use synonyms
seven
categories. The pie chart illustrates how people believe the costs of Change preposition
into seven
adults
education have to Fix the agreement mistake
adult
shared
.
Add a missing verb
be shared
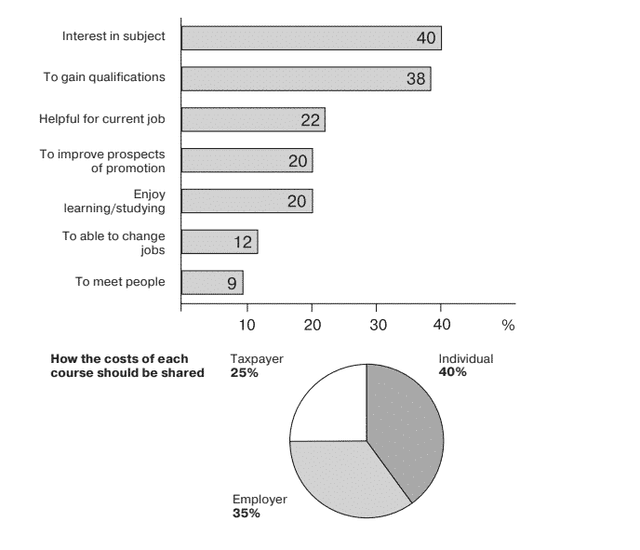
Overall
, the graph indicates that there were Linking Words
grater
percentages of people who Correct your spelling
greater
interested
in Add a missing verb
were interested
subject
and Add an article
the subject
to gain
qualificationsChange the verb form
gaining
higher
.Correct word choice
apply
Furthermore
, the most popular reason to Linking Words
Add a missing verb
be interest
interest
in Replace the word
interested
subject
. For those students who profess that Add an article
the subject
Use synonyms
study
would help them in getting a promotion and that it is an interesting activity, an equal result is gathered (20%). A meagre number of students, 12% and 9%, feel that Replace the word
studying
Use synonyms
study
would assist them Wrong verb form
studying
to get
a new job.
From the second pie chart , Change preposition
in getting
it is clear that
the individual should be the highest cost bearer for his own Linking Words
study
(40%). Use synonyms
Next,
comes the employer at 35% and after that the taxpayer with the least burden (25%) of the cost.Linking Words