Question : The pie charts below show the average household expenditures in Japan and Malaysia in the year 2010.

Question : The pie charts below show the average household expenditures in Japan and Malaysia in the year 2010.
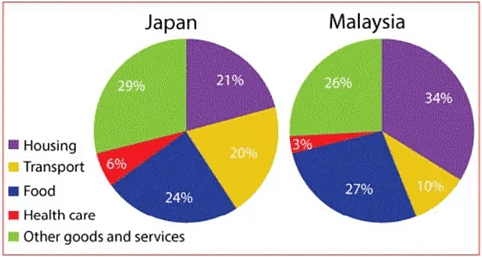
Presented for consideration are 2 pie charts pertaining to the typical household spending in 2 countries in 2010. Generally, Japanese and Malaysians
spent
Wrong verb form
spend
show examples
most of their money on housing and food.
Additionally
, health care was the sector which had the least expenditure. Looking at the first chart in
further
detail, goods and services was the sector which had the most expenditure at 29%
while
the
figure
for health care was the lowest at just 6%.
Besides
, the proportions of housing, transport and food were
also
significant ranging from 20% to 24%. Turning to the second chart, the lesser proportion of transport at 10% compared to the percentage of the same sector in the first chart at 20%.
In addition
, the
figure
for housing was the highest at 34%
while
the
figure
for health care was the lowest at 3%, making it the biggest disparity.
Also
, goods and services and food had a similar
figure
at 26% and 27% respectively.

Unauthorized use and/or duplication of this material without express and written permission from this site’s author and/or owner is strictly prohibited. Excerpts and links may be used, provided that full and clear credit is given to Writing9 with appropriate and specific direction to the original content.

Sentences: Add more complex sentences.
Linking words: Don't use the same linking words: "also, while".
Introduction: The introduction is missing.
Introduction: The chart intro is missing.
Basic structure: Change the second paragraph.
Introduction: The chart intro is missing.
Vocabulary: Replace the words figure with synonyms.
Vocabulary: Rephrase the word "undefined" in your introduction.
Vocabulary: The word "charts" was used 4 times.
Vocabulary: The word "figure" was used 4 times.
Vocabulary: The word "proportions" was used 2 times.
Vocabulary: Use several vocabularies to present the data in the second paragraph.
Topic Vocabulary:
  • household expenditures
  • proportion
  • cultural differences
  • economic differences
  • living standards
  • real estate market
  • public transportation
  • private transportation
  • infrastructure
  • government healthcare policies
  • quality of life
  • holistic view
  • inflation
  • economic growth
  • societal norms
  • globalization
  • communication expenses
  • education expenses
What to do next:
Look at other essays: