The chart below shows the number of trips made by children in one country in 1990 and 2010 to travel to and from school using different modes of transport. Summarise the information by selecting and reporting the main features, and make comparisons where relevant.

The chart below shows the number of trips made by children in one country in 1990 and 2010 to travel to and from school using different modes of transport.


Summarise the information by selecting and reporting the main features, and make comparisons where relevant.
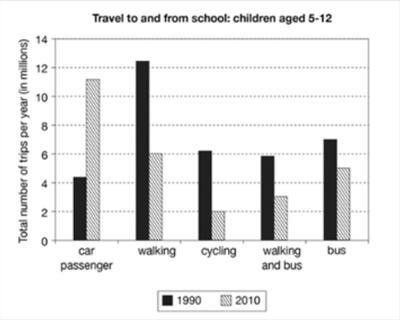
The bar graphs illustrate the information about various modes of transportation required for children between age group 5-12 to travel to and from school in a country in the year 1990 and 2010.
Overall
, In 1990, walking was the main mode of travel and the use of cars was the lowest.
In contrast
to
this
, in the year 2010, the car became the most common way and cycling was not much used.
Firstly
, In 1990, walking to the educational
center
Change the spelling
centre
show examples
was around 12
million
trips
whereas
public transport was approximately 10
million
.
In addition
, cycling, walking and bus were on an average of 6
million
trips. The lowest percentage was the use of car passengers.
Secondly
, In 2010,
due to
the increased use of vehicles, car passengers became the highest about 11
million
while
,
Remove the comma
apply
show examples
cycling to school was not much into consideration with the lowest 2
million
. Walking and public transport
was
Change the verb form
were
show examples
on average between 5-6
million
.
Submitted by noorainfatima135 on

Unauthorized use and/or duplication of this material without express and written permission from this site’s author and/or owner is strictly prohibited. Excerpts and links may be used, provided that full and clear credit is given to Writing9 with appropriate and specific direction to the original content.

Sentences: Add more complex sentences.
Vocabulary: Replace the words million with synonyms.
Vocabulary: The word "about" was used 2 times.
Vocabulary: Use several vocabularies to present the data in the second paragraph.
Topic Vocabulary:
  • trips
  • children
  • modes of transport
  • walk
  • cycle
  • public transport
  • drive
  • car
  • trends
  • decrease
  • increase
  • shift
  • convenient
  • comfortable
  • commuting
  • traffic congestion
  • safety concerns
  • significant
  • indicate
  • reasons
  • traffic congestion
  • safety concerns
  • 20-year period
  • doubled
  • considerable margin
What to do next:
Look at other essays: