The bar chart given information the percentage of the survey results the reason adults choose to study at university while the given pie graph illustrates how adults spend should be shared.

The bar chart given information the percentage of the survey results the reason adults choose to study at university while the given pie graph illustrates how adults spend should be shared.
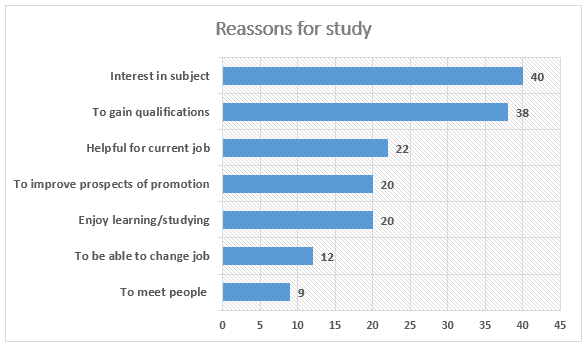
The pie graph gives information about the reasons for studying among adults at university
Overall
, the preference for a subject and gaining qualifications are the most significant factors in other trends
although
both of their percentages are not half of the total
while
the least demand for studying is the chance of meeting people. In terms of subject interest and achieving qualifications are almost the same and dominate significantly among other trends.In reverse, students are rarely fond of meeting new individuals .
Furthermore
, the interest in a current job is followed by the dominance of the preferred subject and qualifications ,almost twice less.The enjoyment of studying is
also
at the same level as the trend regarding obtaining helpful tips for a current job.
Submitted by nazirovmuhammad71 on

Unauthorized use and/or duplication of this material without express and written permission from this site’s author and/or owner is strictly prohibited. Excerpts and links may be used, provided that full and clear credit is given to Writing9 with appropriate and specific direction to the original content.

Common mistake: Your writing should be 150-250 words.
Vocabulary: Rephrase the word "information" in your introduction.
Vocabulary: The word "trends" was used 2 times.
Vocabulary: The word "almost" was used 2 times.
Vocabulary: The word "significant" was used 2 times.
What to do next:
Look at other essays: