
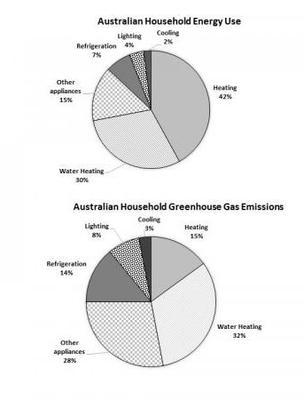
The diagrams illustrate the average energy consumption of household appliances and proportions of the earth heating gases of households in Australia.
Overall
, the households which heat the house's inner space and Linking Words
water
, utilize the largest amount of power. Use synonyms
Additionally
, what is apparent in the figure is that domestic Linking Words
water
heating systems and other appliances produce a larger sum of air pollution in Australian houses.
The three most significant energy users are heaters, Use synonyms
water
heaters, and other facilities which Use synonyms
also
are the main greenhouse gas producers as well.The biggest quantity of energy-acquiring devices belongs to heaters, and they share 42% of the entire energy use. The Linking Words
water
heating equipment ranking second is responsible for 40%, Use synonyms
furthermore
, the other devices comprise 15%. The gas emission chart particularly presents that 32%, 28%, and 15% of total heating gas release routes to Linking Words
water
heating, heating, and other purposes.
The three minor power consumers are the chilling units, the lights, and the refrigerators which account for 2%, 4%, and 7%. Meanwhile, the named facilities are the least air-polluting households with 12%, 7%, and 5% percentages.Use synonyms