
The
given
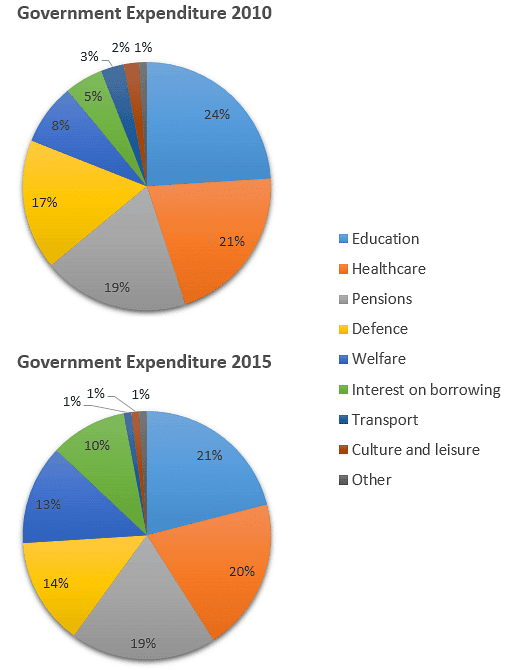
pie charts illustrate the local government encountered expenses in the Verb problem
apply
years
2010 and 2015.
Use synonyms
Overall
, the education sector contributed a significant amount in Linking Words
both
Use synonyms
years
Use synonyms
while
pensions remain a very small amount contribution in the given two Linking Words
years
. In comparison, there are no major changes throughout the Use synonyms
years
in the expenditure of the local government but the small number of hikes can be accounted for from the starting Use synonyms
year
to end.
In Use synonyms
both
Use synonyms
years
most of the expenses are provided to education, healthcare, pensions and defence. Use synonyms
However
in the Linking Words
year
2010 education and defence were at 24% and 17% respectively and it slightly decreased to 21% and 17% in 2015. But very little difference in healthcare Use synonyms
expense
for Fix the agreement mistake
expenses
both
Use synonyms
years
which is only 1% down. Use synonyms
On the other hand
, pensions and other expenses remained the same amount in Linking Words
both
Use synonyms
years
at 19% and 1% respectively.
Even, though some expenditures Use synonyms
are
increased in recent Verb problem
have
years
, when looking at welfare was at 8% in the starting Use synonyms
year
and rose to 13% Use synonyms
at the end
of the Linking Words
year
. Use synonyms
Also
, interest on borrowing increased by 5% in the latest period.Linking Words