
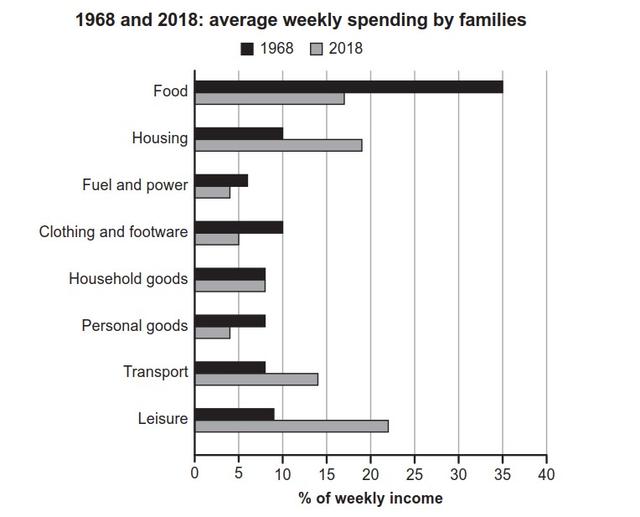
The bar chart compares the proportion of family's expenditures based on their weekly revenue in a specific country in 1968 and 2018.
Overall
, it can be seen that in 1968, the majority of revenue was allocated to food expenses. Linking Words
In contrast
, spending on leisure became the largest proportion in 2018.
In detail, Food expenses have decreased dramatically from 35% to around 17% in the Linking Words
last
60 years. Fuel and power, which is the lowest percentage in 1968, Linking Words
also
fell to around 4% in 2018 as much as personal goods. Linking Words
Similarly
, clothing and footwear Linking Words
also
fall to the half of it in the same period.
Linking Words
In contrast
, leisure had risen significantly from around 9% to over 20% and became the largest proportion of family expenditure in 2018. Linking Words
Likewise
, housing grew approximately twice from 10% to just under 20% in the same year. At around 8%, transportation Linking Words
also
experienced a marked increase to around 14% in 2018. Linking Words
On the other hand
, the unchanged condition was true for household goods, it stood at roughly 8% in the Linking Words
last
60 years.Linking Words