
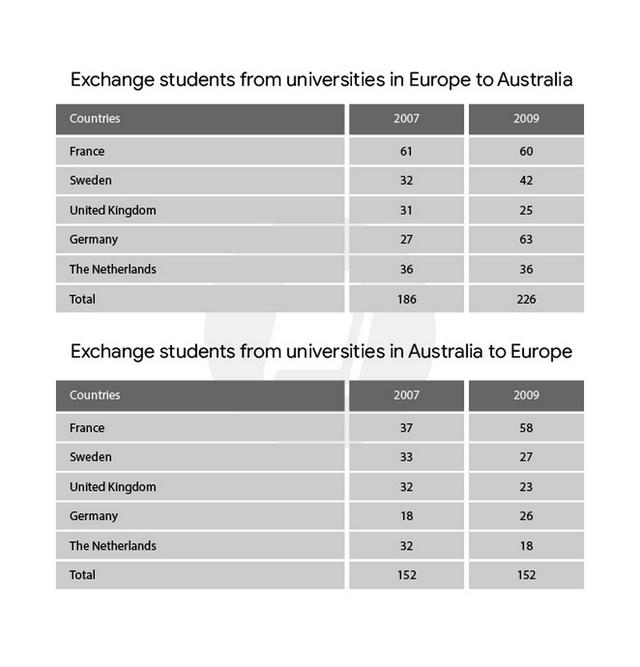
The two tables illustrate the number of students in different countries who changed their universities between Australia and Europe in 2007 and 2009.
Overall
, the biggest exchanges of people were total from Europe to Australia. Meanwhile, the lowest one was the total count of the public who updated their universities from Australia to Europe and they accounted the same Linking Words
overall
in two years.
From the first case, they increased from 189 to 226 because Germany had risen more than 2 times. In 2007 they calculated 27 and after 2 years they were 62. Linking Words
On the other hand
, the second table had a similar count in 2 years, Linking Words
therefore
in time when 1 country decreased their number of students, the second country increased them. Linking Words
For example
, France glared up from 37 to 58, and at that time the Netherlands glared down a little over 2 times their account from 32 to 18.Linking Words