
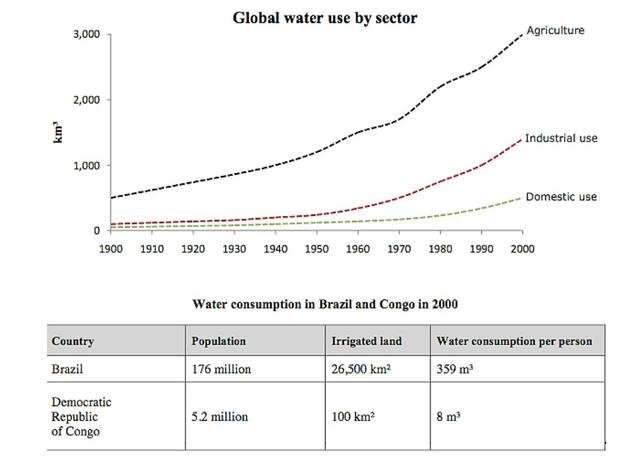
The graph illustrates the information about
water
that was used in agriculture, industrial and domestic, Use synonyms
while
the table presents Linking Words
water
Use synonyms
consumption
in Use synonyms
Brazil
and Use synonyms
Congo
in 2000.
Use synonyms
Overall
, Linking Words
it is clear that
the Linking Words
consumption
of each sector increased over the period given. Use synonyms
Moreover
, Linking Words
Brazil
consumed more Use synonyms
water
than Use synonyms
Congo
.
At the beginning of the year, agriculture used around 500km3 of Use synonyms
water
, which was the highest. Use synonyms
By contrast
, industrial and domestic only used almost one of ten in 1900. By 2000, agriculture still consumed the most which accounted for just under 3,000km3. In the case of industrial and domestic, Linking Words
water
Use synonyms
consumption
went up slightly to roughly 1,300km3 and 500km3 respectively.
Regarding Use synonyms
Brazil
, Use synonyms
water
Use synonyms
consumption
was 359m3 per person which almost tripled Use synonyms
in contrast
to the Linking Words
consumption
of Use synonyms
Congo
. As for the irrigated land, Use synonyms
Brazil
had 265 times more than Use synonyms
Congo
. With regards to the population, Use synonyms
Brazil
had 176 million people, Use synonyms
whereas
Linking Words
Congo
had only 5.2 million people.Use synonyms