
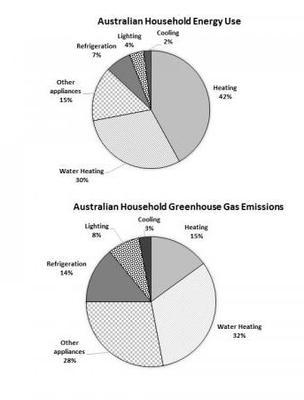
The pie charts illustrate the average domestic
energy
consumption and Use synonyms
greenhouse
Use synonyms
gas
Use synonyms
emissions
in an Australian household. Use synonyms
Energy
is mainly utilized for heating, water heating, cooling, lighting, refrigeration, and other electrical Use synonyms
appliances
.
Use synonyms
Overall
, power is mainly used for heating, and the lowest power is used for cooling purposes.
Linking Words
To begin
with, the ratio between Linking Words
energy
usage and Use synonyms
greenhouse
Use synonyms
emissions
in Australian households were significantly the same; Use synonyms
however
, Linking Words
gas
emission from cooling, other Use synonyms
appliances
, refrigeration, and lighting was higher than the Use synonyms
energy
used. Use synonyms
In addition
, the highest utilization of power was for heating( 42% ) and, Linking Words
as a result
of Linking Words
energy
used, Use synonyms
greenhouse
Use synonyms
gas
emission was 10% lower. Use synonyms
Furthermore
, the second highest Linking Words
energy
was used for water heating (30%), and the Use synonyms
gas
emission was 15%. Use synonyms
On the other hand
, Linking Words
energy
and Use synonyms
greenhouse
Use synonyms
emissions
from cooling, lighting, heating, refrigeration, and other electrical Use synonyms
appliances
remained lower than 30%. Use synonyms
However
, the Linking Words
gas
Use synonyms
emissions
from other Use synonyms
appliances
resulted in 13% more Use synonyms
gas
Use synonyms
emissions
.Use synonyms