
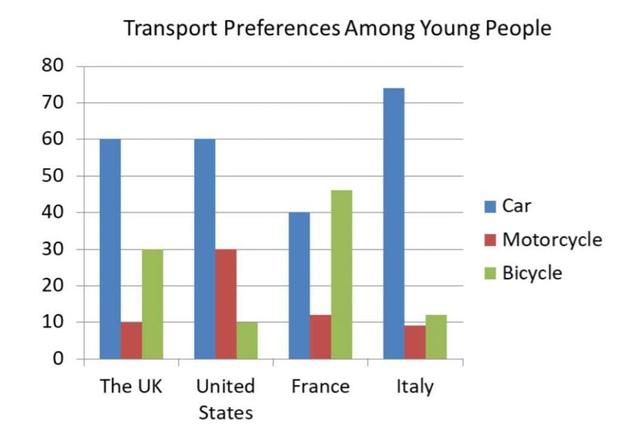
Contained in the illustration is information pertaining to the young
generation
preference in terms of the type of vehicles from four Change noun form
generation's
distinguish
nations.
From an observational perspective, teenagers enjoy using Replace the word
distinguished
automobile
in Great Britain, Add an article
the automobile
Use synonyms
Correct article usage
the USA
USA
and France Correct article usage
the USA
whereas
Linking Words
Use synonyms
Fix the agreement mistake
bikes
bike
Fix the agreement mistake
bikes
was
the most favourable Wrong verb form
are
Correct pronoun usage
ones
one
in Germany. Fix the agreement mistake
ones
Additionally
, the rate of motorcycle usage was the lowest in these countries with the exception of the Linking Words
USA
.
Looking at the graph in Use synonyms
further
detail, Linking Words
three-quater
of the French youngsters Correct your spelling
three-quarters
three-quarter
choosed
Correct your spelling
chose
Use synonyms
car
and only 15% prefer Correct article usage
a car
motorbike
. Correct article usage
a motorbike
Similarly
, there is nearly 30% of British Linking Words
adolescence
nominated Fix the agreement mistake
adolescents
Use synonyms
bike
and the proportion of teens Fix the agreement mistake
bikes
prefering
Correct your spelling
preferring
Use synonyms
car
almost doubled that of Fix the agreement mistake
cars
Use synonyms
bike
. Fix the agreement mistake
bikes
Moreover
, Linking Words
the
Great Britain and France have Correct article usage
apply
the
equal percentage of motorcycle preference, both at 10%.
Moving onto the remaining nations, Correct article usage
an
Use synonyms
car
dominated the Fix the agreement mistake
cars
vote's
rate in the Change noun form
vote
USA
with 60% which was two Use synonyms
time
greater than that of Change to a plural noun
times
motorbike
. Fix the agreement mistake
motorbikes
Furthermore
, the Linking Words
USA
witnessed 10% of young citizens prefer Use synonyms
bicycle
. Fix the agreement mistake
bicycles
In contrast
, Linking Words
Use synonyms
bike
was the main choice in Germany with Add an article
the bike
Correct article usage
an estimatedly
estimatedly
45% and Correct your spelling
estimated
Use synonyms
car
was just 5% lower. Add an article
the car
Lastly
, more than 10% of young residents picked Linking Words
motorbike
.Fix the agreement mistake
motorbikes